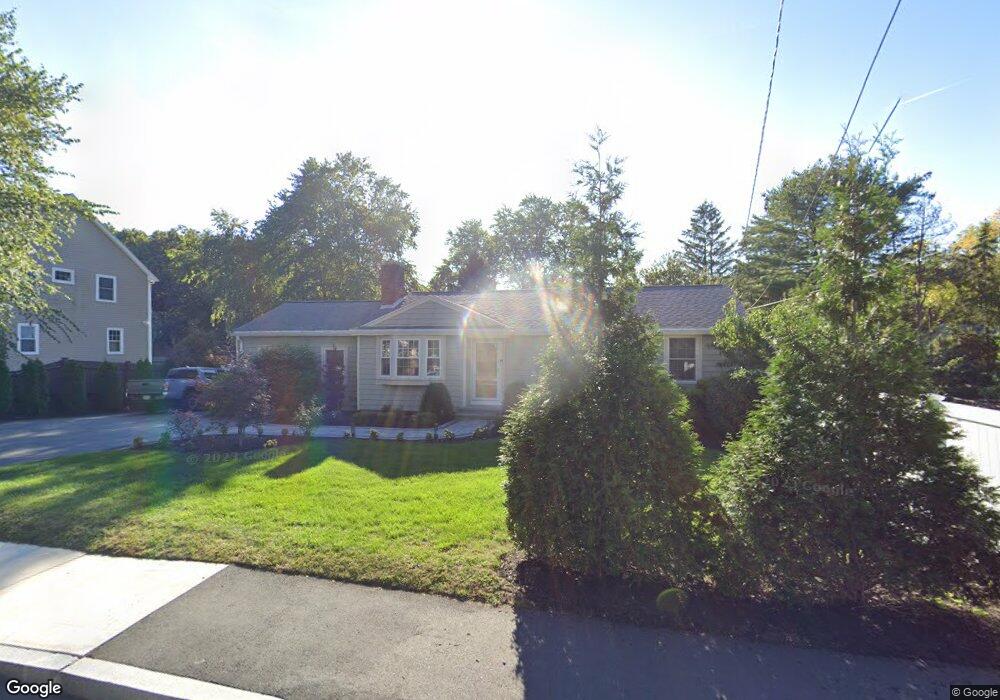
150 Ridge St Winchester, MA 01890
West Side NeighborhoodEstimated Value: $1,216,000 - $1,319,000
3
Beds
2
Baths
1,878
Sq Ft
$663/Sq Ft
Est. Value
About This Home
This home is located at 150 Ridge St, Winchester, MA 01890 and is currently estimated at $1,245,305, approximately $663 per square foot. 150 Ridge St is a home located in Middlesex County with nearby schools including Vinson-Owen Elementary School, McCall Middle School, and Winchester High School.
Ownership History
Date
Name
Owned For
Owner Type
Purchase Details
Closed on
Mar 6, 2024
Sold by
Caloiero Frank and Caloiero Claire A
Bought by
Claire A Caloiero Ret and Caloiero
Current Estimated Value
Purchase Details
Closed on
Jun 30, 2005
Sold by
Kennedy John F and Kennedy Lisa M
Bought by
Caloiero Claire A and Caloiero Frank
Purchase Details
Closed on
Nov 30, 1994
Sold by
Stillman Loretta L
Bought by
Kennedy John F and Kennedy Lisa M
Create a Home Valuation Report for This Property
The Home Valuation Report is an in-depth analysis detailing your home's value as well as a comparison with similar homes in the area
Home Values in the Area
Average Home Value in this Area
Purchase History
| Date | Buyer | Sale Price | Title Company |
|---|---|---|---|
| Claire A Caloiero Ret | -- | None Available | |
| Caloiero Claire A | $615,000 | -- | |
| Kennedy John F | $222,500 | -- |
Source: Public Records
Mortgage History
| Date | Status | Borrower | Loan Amount |
|---|---|---|---|
| Previous Owner | Kennedy John F | $100,000 | |
| Previous Owner | Kennedy John F | $390,000 | |
| Previous Owner | Kennedy John F | $403,000 |
Source: Public Records
Tax History Compared to Growth
Tax History
| Year | Tax Paid | Tax Assessment Tax Assessment Total Assessment is a certain percentage of the fair market value that is determined by local assessors to be the total taxable value of land and additions on the property. | Land | Improvement |
|---|---|---|---|---|
| 2025 | $115 | $1,038,600 | $730,000 | $308,600 |
| 2024 | $11,346 | $1,001,400 | $693,500 | $307,900 |
| 2023 | $10,516 | $891,200 | $602,300 | $288,900 |
| 2022 | $10,410 | $832,100 | $547,500 | $284,600 |
| 2021 | $5,572 | $759,100 | $474,500 | $284,600 |
| 2020 | $9,293 | $750,000 | $465,400 | $284,600 |
| 2019 | $8,530 | $704,400 | $419,800 | $284,600 |
| 2018 | $8,265 | $678,000 | $399,700 | $278,300 |
| 2017 | $8,326 | $678,000 | $399,700 | $278,300 |
| 2016 | $7,612 | $651,700 | $392,400 | $259,300 |
| 2015 | $7,579 | $624,300 | $365,000 | $259,300 |
| 2014 | $7,599 | $600,200 | $355,900 | $244,300 |
Source: Public Records
Map
Nearby Homes