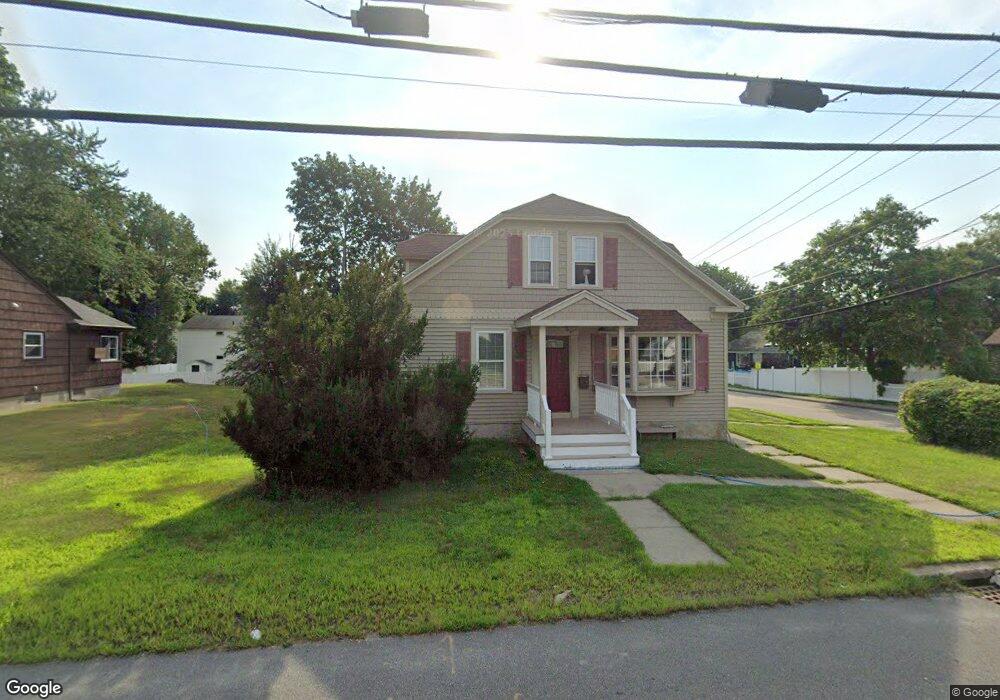
150 S Main St Bellingham, MA 02019
Estimated Value: $485,849 - $647,000
4
Beds
2
Baths
3,010
Sq Ft
$190/Sq Ft
Est. Value
About This Home
This home is located at 150 S Main St, Bellingham, MA 02019 and is currently estimated at $570,962, approximately $189 per square foot. 150 S Main St is a home located in Norfolk County with nearby schools including Joseph F. DiPietro Elementary, Bellingham High School, and Rise Prep Mayoral Academy Middle School.
Ownership History
Date
Name
Owned For
Owner Type
Purchase Details
Closed on
Dec 14, 1982
Bought by
Hogue Roger A and Hogue Kim I
Current Estimated Value
Create a Home Valuation Report for This Property
The Home Valuation Report is an in-depth analysis detailing your home's value as well as a comparison with similar homes in the area
Home Values in the Area
Average Home Value in this Area
Purchase History
| Date | Buyer | Sale Price | Title Company |
|---|---|---|---|
| Hogue Roger A | -- | -- |
Source: Public Records
Mortgage History
| Date | Status | Borrower | Loan Amount |
|---|---|---|---|
| Open | Hogue Roger A | $60,000 | |
| Closed | Hogue Roger A | $30,000 |
Source: Public Records
Tax History
| Year | Tax Paid | Tax Assessment Tax Assessment Total Assessment is a certain percentage of the fair market value that is determined by local assessors to be the total taxable value of land and additions on the property. | Land | Improvement |
|---|---|---|---|---|
| 2025 | $4,844 | $385,700 | $125,300 | $260,400 |
| 2024 | $4,650 | $361,600 | $114,400 | $247,200 |
| 2023 | $4,481 | $343,400 | $108,900 | $234,500 |
| 2022 | $4,413 | $313,400 | $90,900 | $222,500 |
| 2021 | $4,247 | $294,700 | $90,900 | $203,800 |
| 2020 | $4,157 | $292,300 | $90,900 | $201,400 |
| 2019 | $4,060 | $285,700 | $90,900 | $194,800 |
| 2018 | $3,876 | $269,000 | $91,700 | $177,300 |
| 2017 | $3,760 | $262,200 | $91,700 | $170,500 |
| 2016 | $3,570 | $249,800 | $95,300 | $154,500 |
| 2015 | $3,427 | $240,500 | $91,700 | $148,800 |
| 2014 | $3,410 | $232,600 | $88,400 | $144,200 |
Source: Public Records
Map
Nearby Homes
- 70 Oswego St
- 31 S Main St
- 61 Lawrence St
- 101 Pine Grove Ave
- 82 Paine St
- Lot 2 Pulaski Blvd
- 14 Little Tree Ln
- 194 Paine St
- 66 Newland Ave
- 22 Fox Run Rd
- 202 Paine St
- 178 Saint Louis Ave
- 13 Ethel St
- 188 Saint Louis Ave
- 89 Saint Agnes Ave
- 1088 Diamond Hill Rd
- 212 Saint Louis Ave
- 40 Valley St
- 7 Theresa Marie Ave
- 0 Diamond Hill Rd Unit 1406968
Your Personal Tour Guide
Ask me questions while you tour the home.