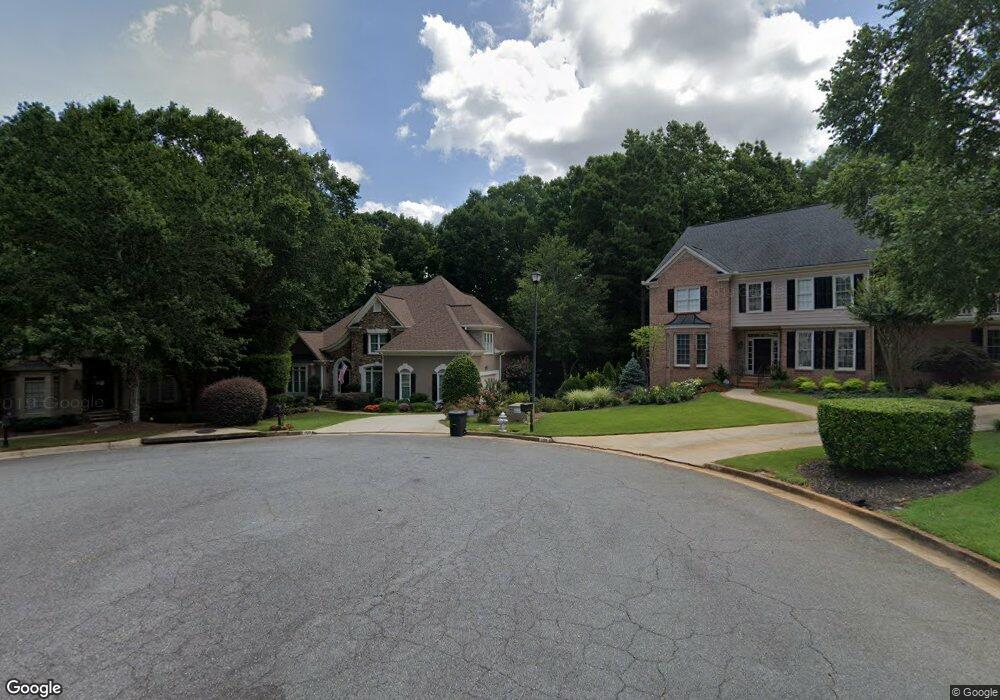
150 Shadow Creek Chase Alpharetta, GA 30022
Nesbit Lakes NeighborhoodEstimated Value: $889,190 - $1,429,000
5
Beds
5
Baths
4,271
Sq Ft
$257/Sq Ft
Est. Value
About This Home
This home is located at 150 Shadow Creek Chase, Alpharetta, GA 30022 and is currently estimated at $1,098,548, approximately $257 per square foot. 150 Shadow Creek Chase is a home located in Fulton County with nearby schools including Hillside Elementary School, Haynes Bridge Middle School, and Centennial High School.
Ownership History
Date
Name
Owned For
Owner Type
Purchase Details
Closed on
Dec 7, 2017
Sold by
Stevens Lee M
Bought by
Stevens Lee M and Trustees Of The Stevens Trust
Current Estimated Value
Purchase Details
Closed on
Dec 15, 2011
Sold by
Maya Lorenzo P
Bought by
Stevens Lee M and Steven Kathleen J
Purchase Details
Closed on
Jul 20, 2007
Sold by
Drennan James E and Drennan Penelope A
Bought by
Maya Lorenzo P and Maya Dianna S
Home Financials for this Owner
Home Financials are based on the most recent Mortgage that was taken out on this home.
Original Mortgage
$275,000
Interest Rate
6.7%
Mortgage Type
New Conventional
Purchase Details
Closed on
Jun 22, 1998
Sold by
Wilsherth Robert E and Wilsherth Clare S
Bought by
Drennan James E and Drennan Penelope A
Home Financials for this Owner
Home Financials are based on the most recent Mortgage that was taken out on this home.
Original Mortgage
$147,900
Interest Rate
7.21%
Mortgage Type
New Conventional
Create a Home Valuation Report for This Property
The Home Valuation Report is an in-depth analysis detailing your home's value as well as a comparison with similar homes in the area
Home Values in the Area
Average Home Value in this Area
Purchase History
| Date | Buyer | Sale Price | Title Company |
|---|---|---|---|
| Stevens Lee M | -- | -- | |
| Stevens Lee M | $525,000 | -- | |
| Maya Lorenzo P | $623,800 | -- | |
| Drennan James E | $414,300 | -- |
Source: Public Records
Mortgage History
| Date | Status | Borrower | Loan Amount |
|---|---|---|---|
| Previous Owner | Maya Lorenzo P | $275,000 | |
| Previous Owner | Drennan James E | $147,900 |
Source: Public Records
Tax History Compared to Growth
Tax History
| Year | Tax Paid | Tax Assessment Tax Assessment Total Assessment is a certain percentage of the fair market value that is determined by local assessors to be the total taxable value of land and additions on the property. | Land | Improvement |
|---|---|---|---|---|
| 2025 | $1,188 | $274,720 | $83,720 | $191,000 |
| 2023 | $7,378 | $261,400 | $60,160 | $201,240 |
| 2022 | $5,142 | $254,000 | $48,360 | $205,640 |
| 2021 | $6,115 | $236,160 | $38,840 | $197,320 |
| 2020 | $6,196 | $224,320 | $46,560 | $177,760 |
| 2019 | $1,012 | $208,360 | $50,280 | $158,080 |
| 2018 | $5,271 | $203,440 | $49,080 | $154,360 |
| 2017 | $5,268 | $195,640 | $47,200 | $148,440 |
| 2016 | $5,242 | $195,640 | $47,200 | $148,440 |
| 2015 | $6,319 | $195,640 | $47,200 | $148,440 |
| 2014 | $4,328 | $154,440 | $27,600 | $126,840 |
Source: Public Records
Map
Nearby Homes
- 205 Nesbit Entry Dr
- 920 Waters Reach Ct
- 940 Waters Reach Ct
- 1035 Penny Ln
- 160 Arden Place
- 9195 Nesbit Lakes Dr
- 2765 Chandon Place
- 9110 Twelvestones Dr
- 585 Saint Regis Ln
- 1096 Township Square
- 1094 Township Square
- 3010 Kara Ct
- 4040 Declaration Dr
- 3020 Kara Ct
- 109 W Ridge Way
- 1020 Summer Oaks Close Unit 4
- 280 Vidaulan Ct
- 140 Shadow Creek Chase
- 195 Shadow Creek Chase Unit 2
- 290 Nesbit Entry Dr
- 130 Shadow Creek Chase
- 420 Nesbit Ridge Ct
- 425 Nesbit Ridge Ct
- 185 Shadow Creek Chase
- 9435 Nesbit Lakes Dr
- 280 Nesbit Entry Dr
- 175 Shadow Creek Chase
- 300 Nesbit Entry Dr
- 410 Nesbit Ridge Ct
- 120 Shadow Creek Chase Unit 2
- 270 Nesbit Entry Dr
- 9425 Nesbit Lakes Dr
- 415 Nesbit Ridge Ct
- 9445 Nesbit Lakes Dr
- 165 Shadow Creek Chase
- 315 Nesbit Entry Dr
- 100 Shadow Creek Chase