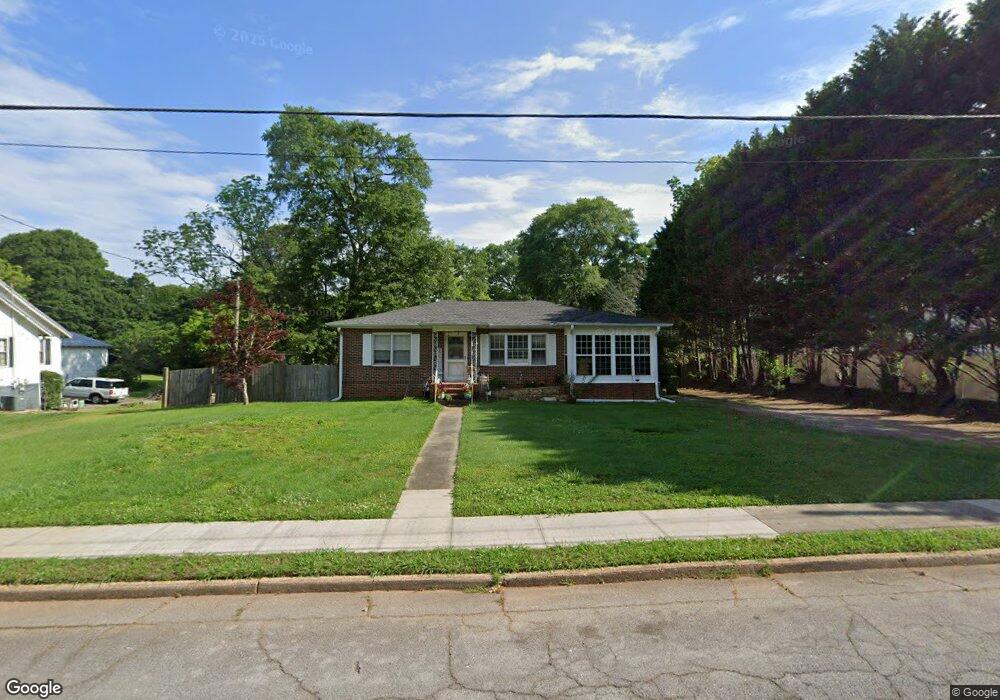
150 Sims St Carrollton, GA 30117
Estimated Value: $204,000 - $224,000
3
Beds
2
Baths
1,104
Sq Ft
$192/Sq Ft
Est. Value
About This Home
This home is located at 150 Sims St, Carrollton, GA 30117 and is currently estimated at $211,760, approximately $191 per square foot. 150 Sims St is a home located in Carroll County with nearby schools including Carrollton Elementary School, Carrollton Upper Elementary School, and Carrollton Middle School.
Ownership History
Date
Name
Owned For
Owner Type
Purchase Details
Closed on
Sep 27, 2002
Sold by
Johnson Eric C and Johnson Janet S
Bought by
Caswell Jack A and Caswell Debra J
Current Estimated Value
Purchase Details
Closed on
Aug 27, 1998
Sold by
Mcdowell Trudy
Bought by
Johnson Eric C and Johnson Janet S
Purchase Details
Closed on
Mar 25, 1998
Sold by
Keith Patricia
Bought by
Mcdowell Trudy
Purchase Details
Closed on
Apr 7, 1995
Sold by
Morad Barney and Morad Audry
Bought by
Morad Barney
Purchase Details
Closed on
Oct 1, 1977
Sold by
Martin Norris John and Martin Brenda H
Bought by
Morad Barney and Morad Audry
Purchase Details
Closed on
Feb 12, 1976
Sold by
Hudgins Joseph Denver
Bought by
Martin Norris John and Martin Brenda H
Purchase Details
Closed on
Jul 18, 1970
Sold by
Terry Homes Inc
Bought by
Hudgins Joseph Denver
Create a Home Valuation Report for This Property
The Home Valuation Report is an in-depth analysis detailing your home's value as well as a comparison with similar homes in the area
Home Values in the Area
Average Home Value in this Area
Purchase History
| Date | Buyer | Sale Price | Title Company |
|---|---|---|---|
| Caswell Jack A | $79,900 | -- | |
| Johnson Eric C | $72,500 | -- | |
| Mcdowell Trudy | $55,000 | -- | |
| Morad Barney | -- | -- | |
| Keith Patricia | -- | -- | |
| Morad Barney | $24,000 | -- | |
| Martin Norris John | $22,200 | -- | |
| Hudgins Joseph Denver | -- | -- |
Source: Public Records
Tax History Compared to Growth
Tax History
| Year | Tax Paid | Tax Assessment Tax Assessment Total Assessment is a certain percentage of the fair market value that is determined by local assessors to be the total taxable value of land and additions on the property. | Land | Improvement |
|---|---|---|---|---|
| 2024 | $1,418 | $51,892 | $6,000 | $45,892 |
| 2023 | $1,418 | $47,886 | $6,000 | $41,886 |
| 2022 | $1,156 | $39,612 | $6,000 | $33,612 |
| 2021 | $1,021 | $34,990 | $6,000 | $28,990 |
| 2020 | $933 | $31,944 | $6,000 | $25,944 |
| 2019 | $876 | $29,698 | $6,000 | $23,698 |
| 2018 | $825 | $27,570 | $6,000 | $21,570 |
| 2017 | $726 | $24,144 | $6,000 | $18,144 |
| 2016 | $730 | $24,144 | $6,000 | $18,144 |
| 2015 | $638 | $20,644 | $4,000 | $16,645 |
| 2014 | $640 | $20,645 | $4,000 | $16,645 |
Source: Public Records
Map
Nearby Homes
- 201 Stewart St
- 120 Stewart St
- 322 Cedar St
- 541 N White St Unit 12
- 541 N White St
- 119 Oxford Square
- 103 Oxford Square
- 777 College St
- 122 Mandeville Ave
- 110 Town Walk Ln
- 123 Cedar Park Way
- 103 W Chandler St
- 123 Autumn Glen Dr
- 0 Ward St Unit 10390499
- 205 Johnson Ave Unit 231
- 114 Green Point Way
- 108 Springwood Dr
- 405 N Park St
- 301 C4 Bradley St
- TRACT1-7 Us Highway 27
- 150 Sims St
- 142 Sims St
- 204 Stewart St
- 0 Sims St Unit 7073081
- 0 Sims St Unit 3241609
- 0 Sims St Unit 8578782
- 0 Sims St Unit 8310130
- 0 Sims St Unit 8136902
- 0 Sims St Unit 7505538
- 0 Sims St Unit 8198294
- 0 Sims St Unit 8071515
- 0 Sims St Unit 7416059
- 136 Sims St
- 216 Stewart St
- 210 Stewart St
- 315 Brown St
- 319 Brown St
- 323 Brown St
- 145 Sims St
- 134 Stewart St