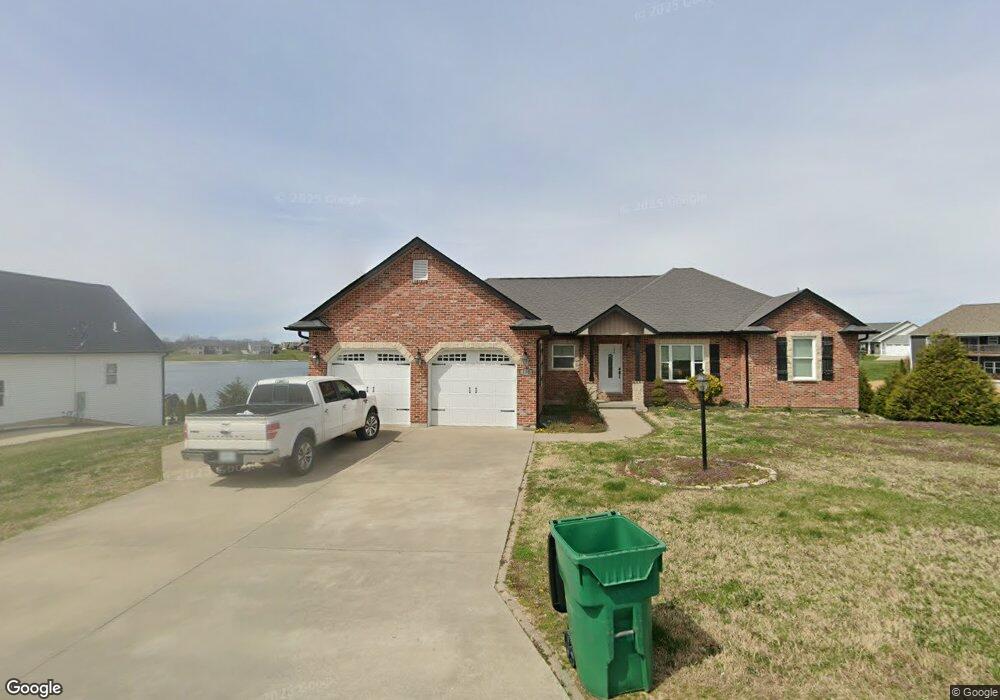
150 Starlight Ridge Cape Girardeau, MO 63701
Estimated Value: $375,000 - $444,000
3
Beds
3
Baths
1,828
Sq Ft
$218/Sq Ft
Est. Value
About This Home
This home is located at 150 Starlight Ridge, Cape Girardeau, MO 63701 and is currently estimated at $399,324, approximately $218 per square foot. 150 Starlight Ridge is a home with nearby schools including Russell Hawkins Junior High School, Jackson Senior High School, and Immaculate Conception School.
Ownership History
Date
Name
Owned For
Owner Type
Purchase Details
Closed on
May 24, 2022
Sold by
Jcjl Properties Llc
Bought by
Kevin G And Constance S Anderson Revocable Tr
Current Estimated Value
Purchase Details
Closed on
Jan 31, 2020
Sold by
Richardet Lynn T
Bought by
Jcjl Prop Llc
Purchase Details
Closed on
Nov 23, 2019
Sold by
Yeargain Galen M and Watson Brooke D
Bought by
Richardet Lynn T and Richardet Revocable Living Trust
Purchase Details
Closed on
Nov 22, 2013
Sold by
Yeargain Galen
Bought by
Yeargain Galen M and Watson Brooke D
Home Financials for this Owner
Home Financials are based on the most recent Mortgage that was taken out on this home.
Original Mortgage
$200,000
Interest Rate
4.34%
Mortgage Type
New Conventional
Purchase Details
Closed on
Sep 12, 2013
Sold by
Enclave Lake Devco Llc
Bought by
Yeargain Galen
Create a Home Valuation Report for This Property
The Home Valuation Report is an in-depth analysis detailing your home's value as well as a comparison with similar homes in the area
Home Values in the Area
Average Home Value in this Area
Purchase History
| Date | Buyer | Sale Price | Title Company |
|---|---|---|---|
| Kevin G And Constance S Anderson Revocable Tr | -- | None Listed On Document | |
| Jcjl Prop Llc | -- | None Available | |
| Richardet Lynn T | -- | None Available | |
| Yeargain Galen M | -- | -- | |
| Yeargain Galen | -- | -- |
Source: Public Records
Mortgage History
| Date | Status | Borrower | Loan Amount |
|---|---|---|---|
| Previous Owner | Yeargain Galen M | $200,000 |
Source: Public Records
Tax History Compared to Growth
Tax History
| Year | Tax Paid | Tax Assessment Tax Assessment Total Assessment is a certain percentage of the fair market value that is determined by local assessors to be the total taxable value of land and additions on the property. | Land | Improvement |
|---|---|---|---|---|
| 2025 | $2,461 | $51,280 | $5,410 | $45,870 |
| 2024 | $22 | $48,830 | $5,150 | $43,680 |
| 2023 | $2,217 | $48,830 | $5,150 | $43,680 |
| 2022 | $2,042 | $45,010 | $4,750 | $40,260 |
| 2021 | $2,042 | $45,010 | $4,750 | $40,260 |
| 2020 | $2,050 | $45,010 | $4,750 | $40,260 |
| 2019 | $2,046 | $45,010 | $0 | $0 |
| 2018 | $2,043 | $45,010 | $0 | $0 |
| 2017 | $2,048 | $45,010 | $0 | $0 |
| 2016 | $2,013 | $44,730 | $0 | $0 |
| 2015 | $2,016 | $44,730 | $0 | $0 |
| 2014 | $5 | $100 | $0 | $0 |
Source: Public Records
Map
Nearby Homes
- 5748 State Highway 25
- 890 State Highway Z
- 357 Timber Ln
- 137
- 0 Lots 143-144 179-180 Saddlebrooke Ridge
- 286 Old Wagon Trail
- 0 Whispy Trail
- 1708 Warren Lake Dr
- 1656 Warren Lake Dr
- 1393 Warren Lake Dr
- 1614 Warren Lake Dr
- 34 Waterhole Trail
- 1201 Cherokee St
- 930 Jackson Trail
- 1120 Pawnee St
- 2405 Brittany Dr
- Lot 97 Stage Coach Ln
- 415 Berchman St
- 1663 Enterprise Ct
- 1552 Enterprise Ct
- 8 Starlight Ridge
- 7 Starlight Ridge
- 4 Starlight Ridge
- 130 Starlight Ridge
- 130 Starlight Ridge
- 195 N Whisper Ridge
- 171 N Whisper Ridge
- 14 N Whisper Ridge
- 157 Starlight Ridge
- 16 N Whisper Ridge
- 141 N Whisper Ridge
- 120 Starlight Ridge
- 214 N Whisper Ridge Rd
- 125 Starlight Ridge
- 11 Starlight Ridge
- 3 Starlight Ridge
- 15 N Whisper Ridge
- 5 Starlight Ridge