150 Stephens Farm Rd Unit 152 Stephens Farm Rd Seneca, SC 29678
Estimated Value: $293,000 - $346,000
2
Beds
2
Baths
1,208
Sq Ft
$266/Sq Ft
Est. Value
About This Home
This home is located at 150 Stephens Farm Rd Unit 152 Stephens Farm Rd, Seneca, SC 29678 and is currently estimated at $321,906, approximately $266 per square foot. 150 Stephens Farm Rd Unit 152 Stephens Farm Rd is a home located in Oconee County with nearby schools including Fair-Oak Elementary School, West Oak Middle School, and West-Oak High School.
Ownership History
Date
Name
Owned For
Owner Type
Purchase Details
Closed on
Mar 10, 2023
Sold by
Moss James A
Bought by
Smimmo Josephine T and Baker Charles E
Current Estimated Value
Home Financials for this Owner
Home Financials are based on the most recent Mortgage that was taken out on this home.
Original Mortgage
$197,000
Outstanding Balance
$190,815
Interest Rate
6.13%
Mortgage Type
New Conventional
Estimated Equity
$131,091
Purchase Details
Closed on
May 17, 2018
Sold by
Oconee Federal Savings And Loan Associat
Bought by
Lilla Amanda L and Moss James A
Home Financials for this Owner
Home Financials are based on the most recent Mortgage that was taken out on this home.
Original Mortgage
$173,375
Interest Rate
4.4%
Mortgage Type
New Conventional
Purchase Details
Closed on
Jul 31, 2009
Sold by
Lusk Jody L and Lusk Laura R
Bought by
Rees James F
Create a Home Valuation Report for This Property
The Home Valuation Report is an in-depth analysis detailing your home's value as well as a comparison with similar homes in the area
Home Values in the Area
Average Home Value in this Area
Purchase History
| Date | Buyer | Sale Price | Title Company |
|---|---|---|---|
| Smimmo Josephine T | $267,000 | -- | |
| Lilla Amanda L | $182,500 | None Available | |
| Rees James F | -- | -- |
Source: Public Records
Mortgage History
| Date | Status | Borrower | Loan Amount |
|---|---|---|---|
| Open | Smimmo Josephine T | $197,000 | |
| Previous Owner | Lilla Amanda L | $173,375 |
Source: Public Records
Tax History Compared to Growth
Tax History
| Year | Tax Paid | Tax Assessment Tax Assessment Total Assessment is a certain percentage of the fair market value that is determined by local assessors to be the total taxable value of land and additions on the property. | Land | Improvement |
|---|---|---|---|---|
| 2024 | $2,873 | $8,911 | $724 | $8,187 |
| 2023 | $591 | $5,557 | $724 | $4,833 |
| 2022 | $591 | $5,557 | $724 | $4,833 |
| 2021 | $612 | $5,472 | $864 | $4,608 |
| 2020 | $609 | $5,472 | $864 | $4,608 |
| 2019 | $609 | $0 | $0 | $0 |
| 2018 | $2,996 | $0 | $0 | $0 |
| 2017 | $612 | $0 | $0 | $0 |
| 2016 | $612 | $0 | $0 | $0 |
| 2015 | -- | $0 | $0 | $0 |
| 2014 | -- | $7,880 | $1,489 | $6,392 |
| 2013 | -- | $0 | $0 | $0 |
Source: Public Records
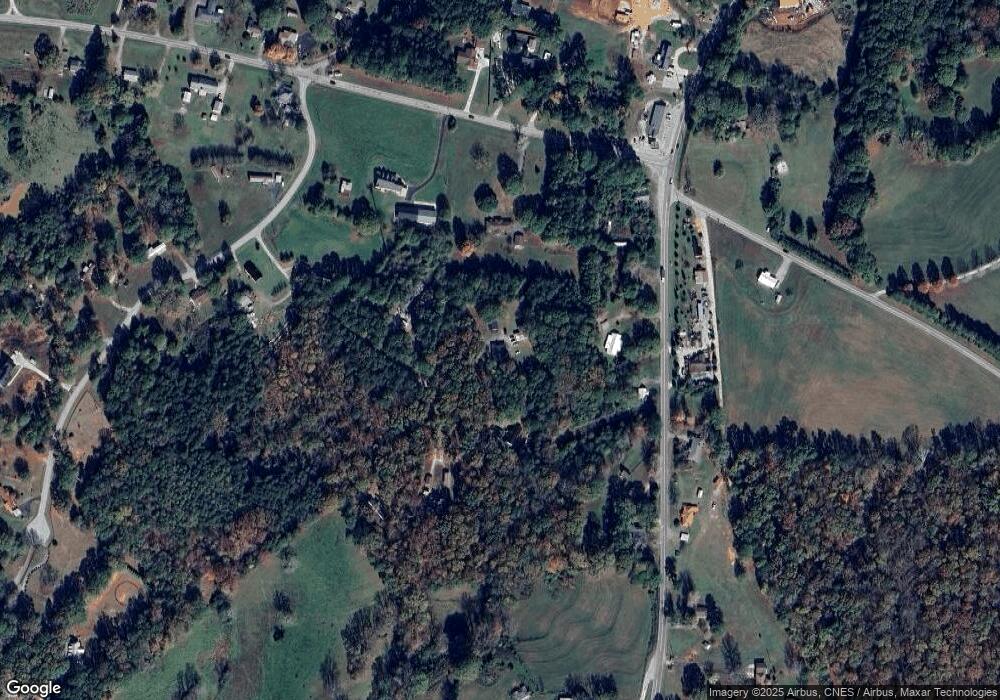
Map
Nearby Homes
- 216 Riverbank Ct
- 105 Winterbrook Cir
- 249 Stone Pond Way
- 207 Devonhurst Dr
- 516 Serria Way
- 1809 Cross Creek Dr
- 1819 Cross Creek Dr
- 504 Copperhead Hill
- 205 Spyglass Ln
- 403 Woodduck Dr
- 1309 Cross Creek Dr
- 1505 Cross Creek Dr
- 420 Gentry Rd
- Lot 30 Cross Creek #Rocky Creek Dr
- Lot 09 Hidden Acres Dr
- 3902 Turnberry Loop
- Gardener ll Plan at Cross Creek Golf Club - Cross Creek Country Club
- Baymore II Plan at Cross Creek Golf Club - Cross Creek Country Club
- Ariel II Plan at Cross Creek Golf Club - Cross Creek Country Club
- Edisto II Plan at Cross Creek Golf Club - Cross Creek Country Club
- 150 Stephens Farm Rd
- 152 Stephens Farm Rd
- 821 Twin Springs Dr
- 135 Stephens Farm Rd
- 520 Tokeena Rd
- 117 Sam Brown Rd
- 530 Tokeena Rd
- 512 Tokeena Rd
- 0 Stephens Farm Rd
- 2.93 Acres Stephens Farm Rd
- 142 Stephens Farm Rd
- 525 Tokeena Rd
- 138 Stephens Farm Rd
- 540 Tokeena Rd
- 121 Sam Brown Rd
- 533 Tokeena Rd
- 546 Tokeena Rd
- 546 Tokeena Rd
- 543 Tokeena Rd
- 116 Stephens Farm Rd