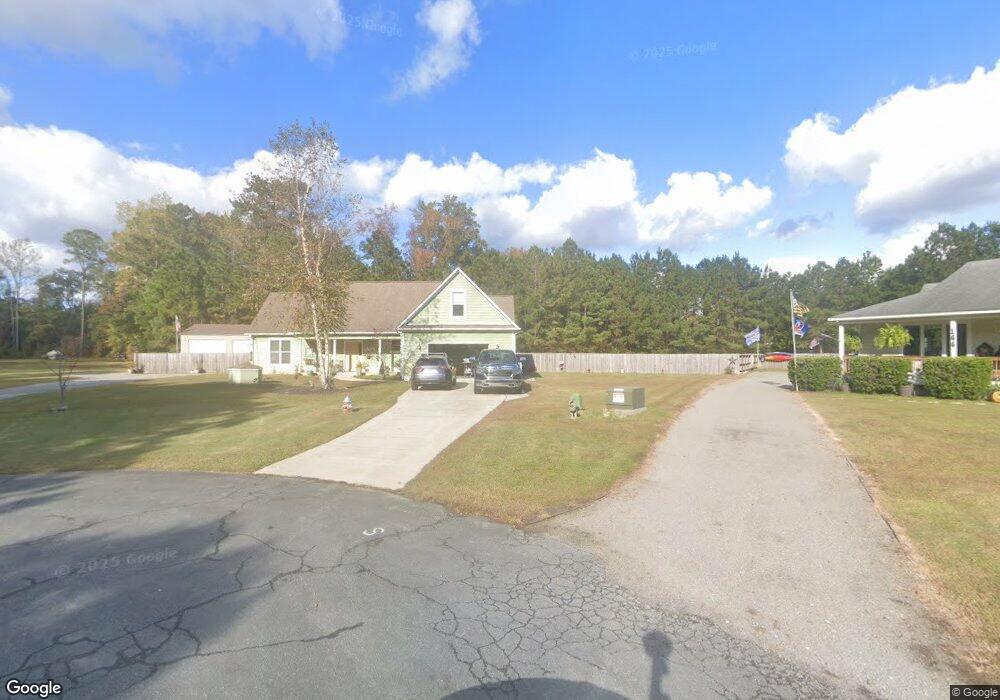
150 Stones Throw Ct Rocky Point, NC 28457
Estimated Value: $407,000 - $451,000
3
Beds
2
Baths
1,932
Sq Ft
$220/Sq Ft
Est. Value
About This Home
This home is located at 150 Stones Throw Ct, Rocky Point, NC 28457 and is currently estimated at $424,144, approximately $219 per square foot. 150 Stones Throw Ct is a home located in Pender County with nearby schools including Cape Fear Elementary School, Cape Fear Middle School, and Heide Trask High School.
Ownership History
Date
Name
Owned For
Owner Type
Purchase Details
Closed on
Dec 10, 2020
Sold by
Streba Jeremy and Streba Catrina
Bought by
Burey Steven P and Burey Janet G
Current Estimated Value
Home Financials for this Owner
Home Financials are based on the most recent Mortgage that was taken out on this home.
Original Mortgage
$178,500
Outstanding Balance
$158,947
Interest Rate
2.71%
Mortgage Type
New Conventional
Estimated Equity
$265,197
Purchase Details
Closed on
Jun 22, 2011
Sold by
Warren William L and Warren Cheryl A
Bought by
Streba Jeremy
Home Financials for this Owner
Home Financials are based on the most recent Mortgage that was taken out on this home.
Original Mortgage
$193,264
Interest Rate
4.65%
Mortgage Type
New Conventional
Create a Home Valuation Report for This Property
The Home Valuation Report is an in-depth analysis detailing your home's value as well as a comparison with similar homes in the area
Home Values in the Area
Average Home Value in this Area
Purchase History
| Date | Buyer | Sale Price | Title Company |
|---|---|---|---|
| Burey Steven P | $278,500 | None Available | |
| Streba Jeremy | $186,500 | -- |
Source: Public Records
Mortgage History
| Date | Status | Borrower | Loan Amount |
|---|---|---|---|
| Open | Burey Steven P | $178,500 | |
| Previous Owner | Streba Jeremy | $193,264 |
Source: Public Records
Tax History Compared to Growth
Tax History
| Year | Tax Paid | Tax Assessment Tax Assessment Total Assessment is a certain percentage of the fair market value that is determined by local assessors to be the total taxable value of land and additions on the property. | Land | Improvement |
|---|---|---|---|---|
| 2024 | $2,020 | $195,652 | $45,500 | $150,152 |
| 2023 | $2,020 | $195,652 | $45,500 | $150,152 |
| 2022 | $1,859 | $195,652 | $45,500 | $150,152 |
| 2021 | $1,674 | $173,562 | $45,500 | $128,062 |
| 2020 | $1,652 | $173,562 | $45,500 | $128,062 |
| 2019 | $1,652 | $173,562 | $45,500 | $128,062 |
| 2018 | $1,884 | $190,807 | $68,250 | $122,557 |
| 2017 | $1,884 | $190,807 | $68,250 | $122,557 |
| 2016 | $1,865 | $190,807 | $68,250 | $122,557 |
| 2015 | $1,848 | $190,807 | $68,250 | $122,557 |
| 2014 | $1,436 | $190,807 | $68,250 | $122,557 |
| 2013 | -- | $190,807 | $68,250 | $122,557 |
| 2012 | -- | $190,807 | $68,250 | $122,557 |
Source: Public Records
Map
Nearby Homes
- 135 Stones Throw Ct
- 894 Pond Rd
- 106 Conklin Ct
- .62 Acres State Highway 210
- 15323 State Highway 210
- 75 Pennsylvania Ave
- 00 Pennsylvania Ave
- Lot 8 Pennsylvania Ave
- 370 Carr Ave
- 884 Cheshire Rd
- 979 Cheshire Rd
- 124 Marlboro Farms Rd
- 000 U S 117
- 113 Lightwood Knot Rd
- 133 Remington Rd
- 345 Lanier Ave
- 11215 U S 117
- 000 Fords Ln
- 94 S Ardsley Ln
- 188 N Ardsley Ln
- 150 Stonesthrow Ct
- 144 Stones Throw Ct
- 144 Stonesthrow Ct
- 126 Stones Throw Ct
- 105 Stones Throw Ct
- 496 Balcombe Rd
- 522 Balcombe Rd
- 4 Stones Throw Ct
- 6 Stones Throw Ct
- 2 Stones Throw Ct
- 544 Balcombe Rd
- 84 Stones Throw Ct
- 444 Balcombe Rd
- 7 Stones Throw Ct
- 568 Balcombe Rd
- 5 Stones Throw Ct
- 418 Balcombe Rd
- 73 Stones Throw Ct
- 592 Balcombe Rd
- 400 Balcombe Rd