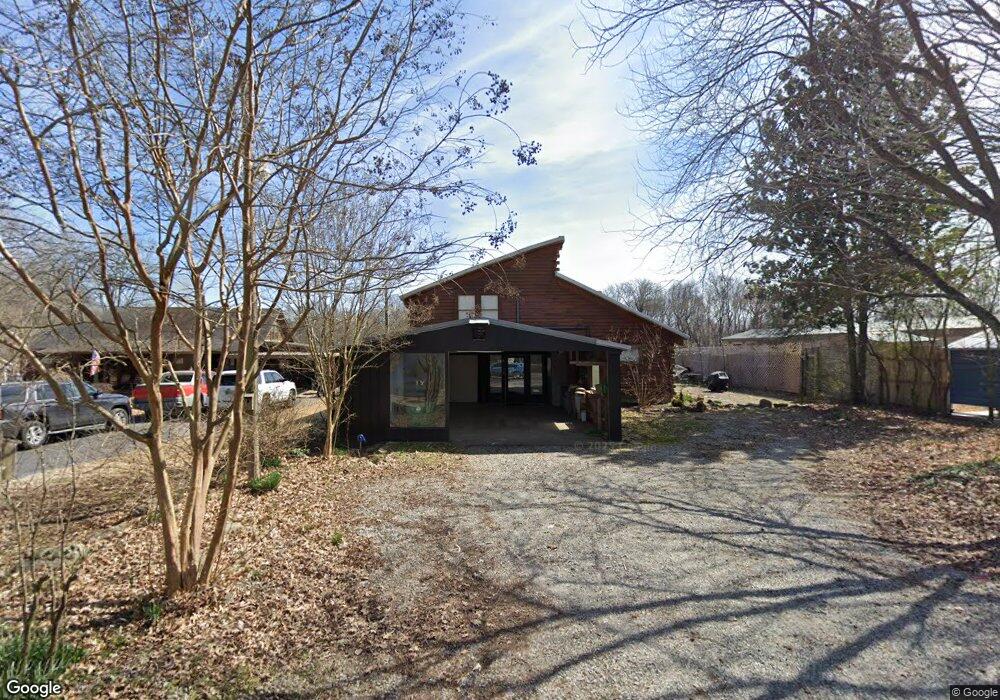
150 Swinging Bridge Dr Heber Springs, AR 72543
Estimated Value: $278,000 - $387,000
--
Bed
2
Baths
1,656
Sq Ft
$197/Sq Ft
Est. Value
About This Home
This home is located at 150 Swinging Bridge Dr, Heber Springs, AR 72543 and is currently estimated at $326,306, approximately $197 per square foot. 150 Swinging Bridge Dr is a home located in Cleburne County with nearby schools including Heber Springs Elementary School, Heber Springs Middle School, and Heber Springs High School.
Ownership History
Date
Name
Owned For
Owner Type
Purchase Details
Closed on
Oct 27, 2006
Sold by
Davenport James R
Bought by
Stjohn William T and Thomas Mary Lou C
Current Estimated Value
Home Financials for this Owner
Home Financials are based on the most recent Mortgage that was taken out on this home.
Original Mortgage
$225,600
Outstanding Balance
$134,641
Interest Rate
6.37%
Mortgage Type
New Conventional
Estimated Equity
$191,665
Purchase Details
Closed on
Sep 22, 2006
Sold by
Lafoon Roger D and Lafoon Barbara B
Bought by
Davenport James R
Home Financials for this Owner
Home Financials are based on the most recent Mortgage that was taken out on this home.
Original Mortgage
$225,600
Outstanding Balance
$134,641
Interest Rate
6.37%
Mortgage Type
New Conventional
Estimated Equity
$191,665
Purchase Details
Closed on
Feb 17, 1999
Bought by
Lafoon Roger and Lafoon Barbara
Purchase Details
Closed on
Dec 7, 1998
Bought by
Lafoon Roger D and Lafoon Barbara B
Purchase Details
Closed on
Oct 1, 1985
Bought by
Burkeen Bobby E and Burkeen Polly
Create a Home Valuation Report for This Property
The Home Valuation Report is an in-depth analysis detailing your home's value as well as a comparison with similar homes in the area
Home Values in the Area
Average Home Value in this Area
Purchase History
| Date | Buyer | Sale Price | Title Company |
|---|---|---|---|
| Stjohn William T | $282,000 | -- | |
| Davenport James R | $275,000 | -- | |
| Lafoon Roger | -- | -- | |
| Lafoon Roger D | $300,000 | -- | |
| Burkeen Bobby E | -- | -- |
Source: Public Records
Mortgage History
| Date | Status | Borrower | Loan Amount |
|---|---|---|---|
| Open | Stjohn William T | $225,600 | |
| Closed | Davenport James R | $260,000 |
Source: Public Records
Tax History Compared to Growth
Tax History
| Year | Tax Paid | Tax Assessment Tax Assessment Total Assessment is a certain percentage of the fair market value that is determined by local assessors to be the total taxable value of land and additions on the property. | Land | Improvement |
|---|---|---|---|---|
| 2024 | $1,582 | $49,897 | $15,000 | $34,897 |
| 2023 | $1,460 | $49,897 | $15,000 | $34,897 |
| 2022 | $1,389 | $49,897 | $15,000 | $34,897 |
| 2021 | $1,267 | $32,106 | $14,000 | $18,106 |
| 2020 | $1,267 | $32,106 | $14,000 | $18,106 |
| 2019 | $1,267 | $32,106 | $14,000 | $18,106 |
| 2018 | $1,267 | $32,106 | $14,000 | $18,106 |
| 2017 | $1,267 | $32,106 | $14,000 | $18,106 |
| 2016 | $1,846 | $47,392 | $25,000 | $22,392 |
| 2015 | $1,796 | $47,392 | $25,000 | $22,392 |
| 2014 | $1,796 | $47,392 | $25,000 | $22,392 |
Source: Public Records
Map
Nearby Homes
- 7 Swinging Bridge Dr
- 3 Swinging Bridge Dr
- 1 Swinging Bridge Dr
- 2 Swinging Bridge Dr
- 9 Jared Dr
- 22 Winkley Shoals Cove
- 10 Old Ford Way
- 29 N Winkley Shoals Cove
- 31 N Winkley Shoals Cove
- 1100 Wilburn Rd
- Lots 8 and 9 Winkley Shoals Cove Cove N
- 1520 Wilburn Rd
- Lot 27 Oxbow Landing
- 15 Industrial Park Rd
- Lot 28 Oxbow Landing
- 000 Clubhouse Cir
- 601 River Dr
- 000 Industrial Park Rd
- 20 Sugarloaf Ln
- 4 Little Red Ln
- 144 Swinging Bridge Dr
- 108 Swinging Bridge Dr
- 170 Swinging Bridge Dr
- 170 Swinging Bridge Dr
- lot 19 Swinging Bridge Dr
- 104 Swinging Bridge Dr
- 190 Swinging Bridge Dr
- 200 Swinging Bridge Dr
- 180 Swinging Bridge Dr
- 180 Swinging Bridge Dr
- 204 Swinging Bridge Dr
- 0 Swinging Bridge Rd
- 0 Swinging Bridge Dr Unit 16034330
- 0 Swinging Bridge Dr Unit 17008534
- 0 Swinging Bridge Dr Unit 3E, 9E, 10E 17008526
- 0 Swinging Bridge Dr
- 224 Swinging Bridge Dr
- 220 Swinging Bridge Dr
- 220 Swinging Bridge Dr
- 1259 Wilburn Rd