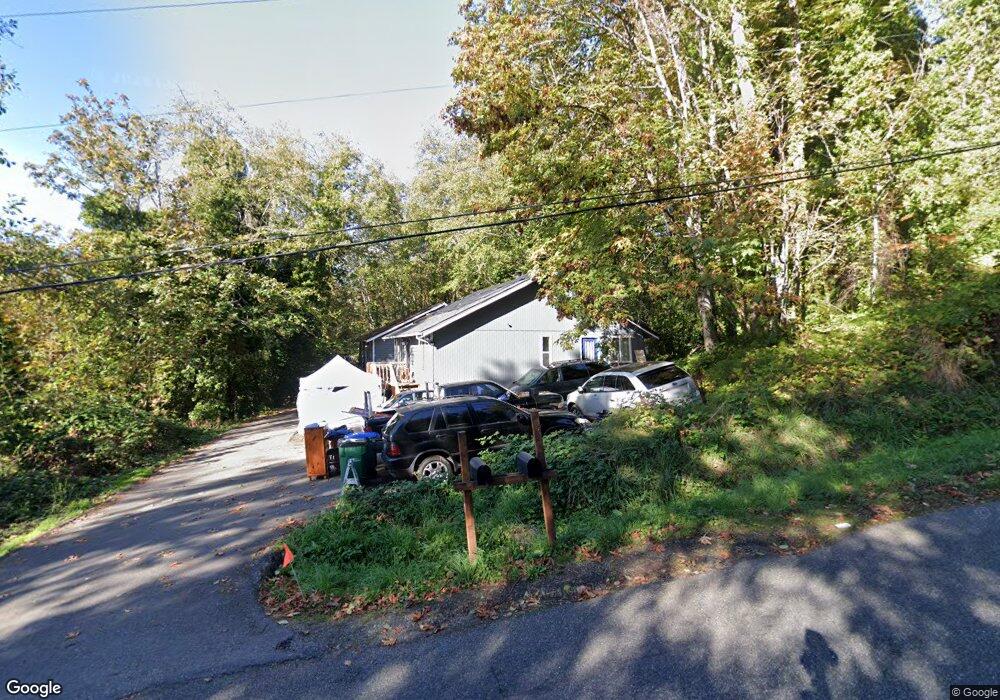
150 Sylvan Way Bremerton, WA 98310
Estimated Value: $463,000 - $599,624
4
Beds
2
Baths
1,768
Sq Ft
$286/Sq Ft
Est. Value
About This Home
This home is located at 150 Sylvan Way, Bremerton, WA 98310 and is currently estimated at $504,906, approximately $285 per square foot. 150 Sylvan Way is a home located in Kitsap County with nearby schools including Armin Jahr Elementary School, Mountain View Middle School, and Bremerton High School.
Ownership History
Date
Name
Owned For
Owner Type
Purchase Details
Closed on
Sep 5, 2013
Sold by
Moore Kristina R and Moore Eric W
Bought by
Moore Eric W and Moore Kristina R
Current Estimated Value
Home Financials for this Owner
Home Financials are based on the most recent Mortgage that was taken out on this home.
Original Mortgage
$265,300
Outstanding Balance
$197,662
Interest Rate
4.36%
Mortgage Type
New Conventional
Estimated Equity
$307,244
Purchase Details
Closed on
Jul 13, 2005
Sold by
Rotondo Eric D and Rotondo Mary A
Bought by
Golbeck Kristina R and Moore Eric W
Home Financials for this Owner
Home Financials are based on the most recent Mortgage that was taken out on this home.
Original Mortgage
$198,879
Interest Rate
5.55%
Mortgage Type
FHA
Purchase Details
Closed on
Aug 29, 2000
Sold by
Veloni Dennis H and Veloni Vickie M
Bought by
Rotondo Eric D
Home Financials for this Owner
Home Financials are based on the most recent Mortgage that was taken out on this home.
Original Mortgage
$140,109
Interest Rate
8.2%
Mortgage Type
FHA
Create a Home Valuation Report for This Property
The Home Valuation Report is an in-depth analysis detailing your home's value as well as a comparison with similar homes in the area
Home Values in the Area
Average Home Value in this Area
Purchase History
| Date | Buyer | Sale Price | Title Company |
|---|---|---|---|
| Moore Eric W | -- | None Available | |
| Golbeck Kristina R | $202,280 | First American Title Ins | |
| Rotondo Eric D | $142,000 | Transnation Title Insurance |
Source: Public Records
Mortgage History
| Date | Status | Borrower | Loan Amount |
|---|---|---|---|
| Open | Moore Eric W | $265,300 | |
| Closed | Golbeck Kristina R | $198,879 | |
| Previous Owner | Rotondo Eric D | $140,109 |
Source: Public Records
Tax History Compared to Growth
Tax History
| Year | Tax Paid | Tax Assessment Tax Assessment Total Assessment is a certain percentage of the fair market value that is determined by local assessors to be the total taxable value of land and additions on the property. | Land | Improvement |
|---|---|---|---|---|
| 2026 | $4,129 | $477,280 | $159,020 | $318,260 |
| 2025 | $4,129 | $477,280 | $159,020 | $318,260 |
| 2024 | $3,983 | $477,280 | $159,020 | $318,260 |
| 2023 | $4,117 | $477,280 | $159,020 | $318,260 |
| 2022 | $3,812 | $397,740 | $132,520 | $265,220 |
| 2021 | $3,344 | $319,430 | $108,100 | $211,330 |
| 2020 | $3,132 | $299,320 | $100,800 | $198,520 |
| 2019 | $2,718 | $269,880 | $90,570 | $179,310 |
| 2018 | $3,058 | $197,700 | $73,040 | $124,660 |
| 2017 | $2,528 | $197,700 | $73,040 | $124,660 |
| 2016 | $2,423 | $179,470 | $70,020 | $109,450 |
| 2015 | $2,329 | $171,750 | $78,810 | $92,940 |
| 2014 | $2,344 | $167,530 | $78,810 | $88,720 |
| 2013 | $2,541 | $189,960 | $84,340 | $105,620 |
Source: Public Records
Map
Nearby Homes
- 3560 Narrows View Ln NE Unit 5-201
- 3560 Narrows View Ln NE Unit 202
- 3347 Amak Ln
- 3400 Narrows View Ln NE Unit 204
- 3340 Narrows View Ln NE Unit 103
- 4 Sulphur Springs Ln
- 0 XXX Tracyton Beach Rd NW
- 0 Tracyton Beach Rd NW
- 3573 Sulphur Springs Ln
- 3585 Sulphur Springs Ln
- 3023 Pawnee Dr
- 414 E 31st St
- 3868 Pinecone Dr NE
- 4224 Tracyton Beach Rd
- 654 E 31st St
- 3835 Earendale Ave
- 638 Shirehill St
- 802 Hanford Ave
- 2540 E Phinney Bay Place
- 2727 Hefner Ave
- 208 Alnus Way
- 206 Alnus Way
- 134 Sylvan Way
- 138 Blackfish Ct
- 207 Alnus Way
- 142 Blackfish Ct
- 134 Blackfish Ct
- 205 Alnus Way
- 146 Blackfish Ct
- 130 Blackfish Ct
- 130 Sylvan Way
- 3517 Monticola Dr
- 139 Blackfish Ct
- 0 Reagan Unit 1934522
- 0 Reagan Unit 1933430
- 131 Blackfish Ct
- 3503 Monticola Dr
- 143 Blackfish Ct
- 128 Blackfish Ct
- 3580 Narrows View Ln NE Unit 2-103