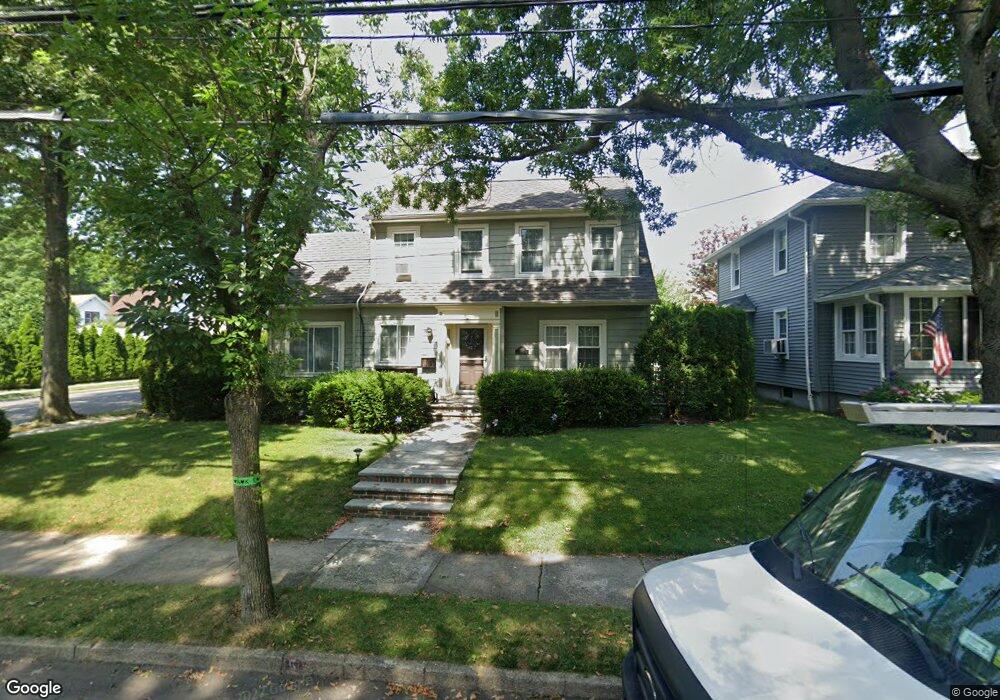
150 Verbena Ave Floral Park, NY 11001
Estimated Value: $977,410 - $1,317,000
3
Beds
3
Baths
2,012
Sq Ft
$570/Sq Ft
Est. Value
About This Home
This home is located at 150 Verbena Ave, Floral Park, NY 11001 and is currently estimated at $1,147,205, approximately $570 per square foot. 150 Verbena Ave is a home located in Nassau County with nearby schools including Our Lady Of Victory School.
Ownership History
Date
Name
Owned For
Owner Type
Purchase Details
Closed on
Dec 5, 2016
Sold by
Cheung Dorothy
Bought by
Chu Jennifer and Chan Shirlane
Current Estimated Value
Home Financials for this Owner
Home Financials are based on the most recent Mortgage that was taken out on this home.
Original Mortgage
$420,000
Outstanding Balance
$339,352
Interest Rate
3.54%
Mortgage Type
New Conventional
Estimated Equity
$807,853
Purchase Details
Closed on
Nov 29, 2012
Sold by
Franklin Stephen and Cheung Dorothy
Bought by
Cheung Dorothy
Home Financials for this Owner
Home Financials are based on the most recent Mortgage that was taken out on this home.
Original Mortgage
$2,688
Interest Rate
3.44%
Mortgage Type
New Conventional
Purchase Details
Closed on
Sep 25, 2007
Sold by
Tuffy Thomas
Bought by
Franklin Stephen
Purchase Details
Closed on
Feb 13, 2003
Sold by
Burkhardt Charles
Bought by
Tuffy Thomas
Create a Home Valuation Report for This Property
The Home Valuation Report is an in-depth analysis detailing your home's value as well as a comparison with similar homes in the area
Home Values in the Area
Average Home Value in this Area
Purchase History
| Date | Buyer | Sale Price | Title Company |
|---|---|---|---|
| Chu Jennifer | $720,000 | Fidelity National Title Insu | |
| Cheung Dorothy | -- | -- | |
| Franklin Stephen | $715,000 | -- | |
| Tuffy Thomas | $500,000 | -- |
Source: Public Records
Mortgage History
| Date | Status | Borrower | Loan Amount |
|---|---|---|---|
| Open | Chu Jennifer | $420,000 | |
| Previous Owner | Cheung Dorothy | $2,688 |
Source: Public Records
Tax History Compared to Growth
Tax History
| Year | Tax Paid | Tax Assessment Tax Assessment Total Assessment is a certain percentage of the fair market value that is determined by local assessors to be the total taxable value of land and additions on the property. | Land | Improvement |
|---|---|---|---|---|
| 2025 | $11,006 | $642 | $315 | $327 |
| 2024 | $1,397 | $662 | $325 | $337 |
| 2023 | $10,378 | $697 | $342 | $355 |
| 2022 | $10,378 | $695 | $341 | $354 |
| 2021 | $13,933 | $695 | $341 | $354 |
| 2020 | $9,344 | $883 | $853 | $30 |
| 2019 | $9,751 | $883 | $853 | $30 |
| 2018 | $9,119 | $883 | $0 | $0 |
| 2017 | $6,379 | $938 | $803 | $135 |
| 2016 | $7,735 | $997 | $706 | $291 |
| 2015 | $1,480 | $997 | $706 | $291 |
| 2014 | $1,480 | $997 | $706 | $291 |
| 2013 | $1,640 | $1,204 | $853 | $351 |
Source: Public Records
Map
Nearby Homes
- 20 Geranium Ave
- 104 Geranium Ave
- 103 Calla Ave
- 345 Plainfield Ave
- 85 Violet Ave
- 22 Pansy Ave
- 43 Floral Blvd Unit 1C
- 10 Pansy Ave
- 1 Childs Ave Unit 1E
- 88 Mayfair Ave
- 128 Beech St
- 56 Floral Pkwy
- 84 Superior Rd
- 77 Floral Pkwy
- 78 Ontario Rd
- 215 W Poplar St
- 34 Vandewater Ave
- 5 Adelaide St Unit B1 D2
- 5 Adelaide St Unit B2D1
- 100 Memphis Ave
- 144 Verbena Ave
- 140 Verbena Ave
- 152 Verbena Ave
- 55 Geranium Ave
- 51 Geranium Ave
- 47 Geranium Ave
- 63 Geranium Ave
- 136 Verbena Ave
- 149 Verbena Ave
- 145 Verbena Ave
- 67 Geranium Ave
- 43 Geranium Ave
- 153 Verbena Ave
- 141 Verbena Ave
- 132 Verbena Ave
- 160 Verbena Ave
- 71 Geranium Ave
- 155 Verbena Ave
- 137 Verbena Ave
- 39 Geranium Ave