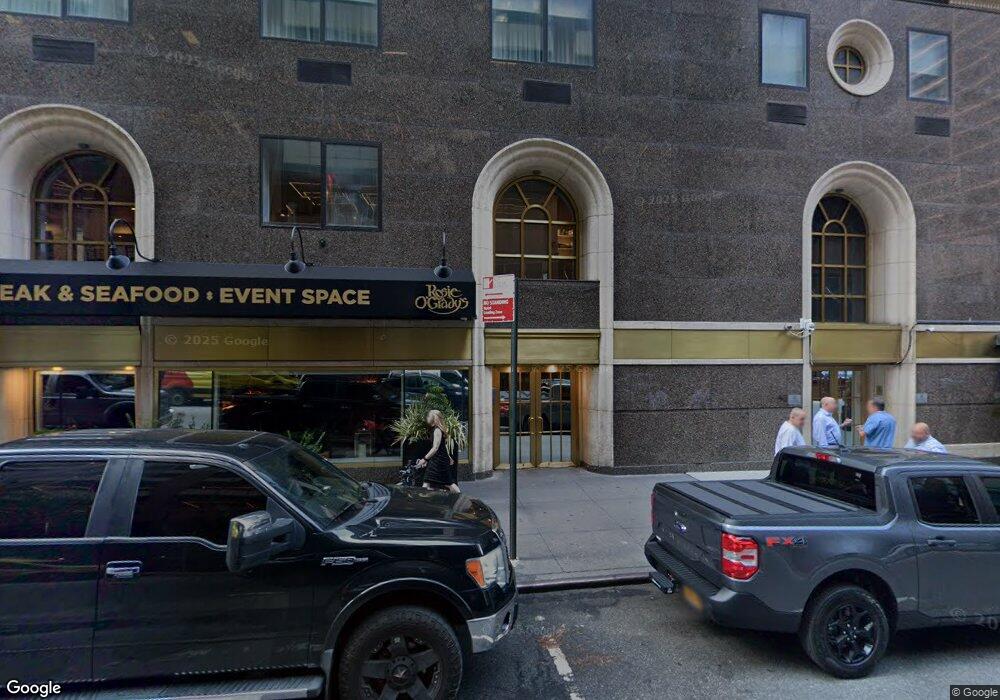
Executive Plaza 150 W 51st St Unit 124 New York, NY 10019
Times Square NeighborhoodEstimated Value: $562,000 - $720,000
--
Bed
--
Bath
494
Sq Ft
$1,291/Sq Ft
Est. Value
About This Home
This home is located at 150 W 51st St Unit 124, New York, NY 10019 and is currently estimated at $637,719, approximately $1,290 per square foot. 150 W 51st St Unit 124 is a home located in New York County with nearby schools including P.S. 111 Adolph S. Ochs, Clinton School, and Middle School 297.
Ownership History
Date
Name
Owned For
Owner Type
Purchase Details
Closed on
Feb 5, 2014
Sold by
West Portal Holdings Llc
Bought by
Yu Ruby Yen Hung and Yu Yen Hung
Current Estimated Value
Purchase Details
Closed on
Jul 6, 2011
Sold by
Gerchberg Jeanne and Gerchberg Seth
Bought by
West Portal Holdings Llc
Purchase Details
Closed on
Oct 27, 2004
Sold by
51St Street Associates Llc and Thomas C
Bought by
Plaza 51 Llc
Purchase Details
Closed on
Jan 25, 2001
Sold by
Miller Donald and % Goldberg Corwin & Greenberg Llp
Bought by
51St Street Associates Llc
Home Financials for this Owner
Home Financials are based on the most recent Mortgage that was taken out on this home.
Original Mortgage
$230,000
Interest Rate
7%
Purchase Details
Closed on
Apr 30, 1999
Sold by
Esp Llc
Bought by
Talamasca Investment Ltd
Create a Home Valuation Report for This Property
The Home Valuation Report is an in-depth analysis detailing your home's value as well as a comparison with similar homes in the area
Home Values in the Area
Average Home Value in this Area
Purchase History
| Date | Buyer | Sale Price | Title Company |
|---|---|---|---|
| Yu Ruby Yen Hung | $660,000 | -- | |
| Yu Ruby Yen Hung | $660,000 | -- | |
| West Portal Holdings Llc | $575,000 | -- | |
| West Portal Holdings Llc | $575,000 | -- | |
| Plaza 51 Llc | $320,000 | -- | |
| Plaza 51 Llc | $320,000 | -- | |
| 51St Street Associates Llc | -- | -- | |
| Miller Donald | $292,000 | -- | |
| Miller Donald | $292,000 | -- | |
| 51St Street Associates Llc | -- | -- | |
| Talamasca Investment Ltd | $200,000 | -- | |
| Talamasca Investment Ltd | $200,000 | -- |
Source: Public Records
Mortgage History
| Date | Status | Borrower | Loan Amount |
|---|---|---|---|
| Previous Owner | Miller Donald | $230,000 |
Source: Public Records
Tax History Compared to Growth
Tax History
| Year | Tax Paid | Tax Assessment Tax Assessment Total Assessment is a certain percentage of the fair market value that is determined by local assessors to be the total taxable value of land and additions on the property. | Land | Improvement |
|---|---|---|---|---|
| 2025 | $10,274 | $82,613 | $23,344 | $59,269 |
| 2024 | $10,274 | $82,178 | $23,344 | $58,834 |
| 2023 | $8,326 | $82,267 | $23,344 | $58,923 |
| 2022 | $7,207 | $76,570 | $23,344 | $53,226 |
| 2021 | $10,298 | $83,945 | $23,344 | $60,601 |
| 2020 | $8,604 | $93,346 | $23,344 | $70,002 |
| 2019 | $8,242 | $93,349 | $23,344 | $70,005 |
| 2018 | $9,654 | $93,362 | $23,344 | $70,018 |
| 2017 | $9,003 | $83,484 | $23,344 | $60,140 |
| 2016 | $8,607 | $77,990 | $23,344 | $54,646 |
| 2015 | $4,621 | $66,157 | $23,344 | $42,813 |
| 2014 | $4,621 | $66,490 | $23,344 | $43,146 |
Source: Public Records
About Executive Plaza
Map
Nearby Homes
- 150 W 51st St Unit 1032
- 150 W 51st St Unit 928
- 150 W 51st St Unit 1919
- 150 W 51st St Unit 1428
- 150 W 51st St Unit 1017
- 150 W 51st St Unit 151
- 150 W 51st St Unit 1932
- 150 W 51st St Unit 2032
- 150 W 51st St Unit 1927
- 150 W 51st St Unit 1623
- 150 W 51st St Unit 1508
- 135 W 52nd St Unit PH1
- 135 W 52nd St Unit 9E
- 135 W 52nd St Unit 31-B
- 135 W 52nd St Unit 40A
- 135 W 52nd St Unit 17B
- 1600 Broadway Unit 11F
- 1600 Broadway Unit 17A
- 1600 Broadway Unit 16G
- 1600 Broadway Unit 20A
- 150 W 51st St Unit FL8-ID1017471P
- 150 W 51st St Unit 1928
- 150 W 51st St Unit 1816
- 150 W 51st St Unit 1619
- 150 W 51st St Unit 2124
- 150 W 51st St Unit 2123
- 150 W 51st St Unit 2122
- 150 W 51st St Unit 2121
- 150 W 51st St Unit 2120
- 150 W 51st St Unit 2119
- 150 W 51st St Unit 2118
- 150 W 51st St Unit 2117
- 150 W 51st St Unit 2116
- 150 W 51st St Unit 2115
- 150 W 51st St Unit 2114
- 150 W 51st St Unit 2112
- 150 W 51st St Unit 2111
- 150 W 51st St Unit 2110
- 150 W 51st St Unit 219
- 150 W 51st St Unit 218