Estimated Value: $485,996 - $532,000
2
Beds
1
Bath
1,155
Sq Ft
$439/Sq Ft
Est. Value
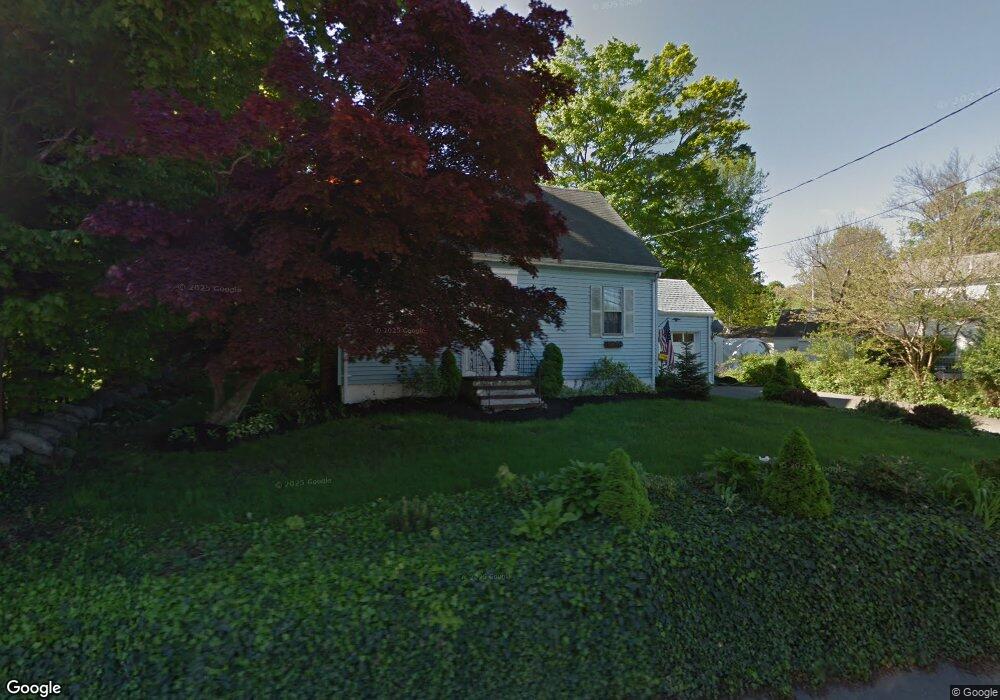
About This Home
This home is located at 150 W High St, Avon, MA 02322 and is currently estimated at $506,999, approximately $438 per square foot. 150 W High St is a home located in Norfolk County with nearby schools including Ralph D. Butler Elementary School, Avon Middle/High School, and Lighthouse Baptist Christian Academy.
Ownership History
Date
Name
Owned For
Owner Type
Purchase Details
Closed on
Oct 29, 2004
Sold by
Leonard Kathleen and Leonard Terence J
Bought by
Osiecki Carol M
Current Estimated Value
Home Financials for this Owner
Home Financials are based on the most recent Mortgage that was taken out on this home.
Original Mortgage
$242,910
Outstanding Balance
$120,897
Interest Rate
5.74%
Mortgage Type
Purchase Money Mortgage
Estimated Equity
$386,102
Purchase Details
Closed on
Oct 15, 2001
Sold by
Stephen Deborah J
Bought by
Leonard Terence J
Home Financials for this Owner
Home Financials are based on the most recent Mortgage that was taken out on this home.
Original Mortgage
$180,500
Interest Rate
6.93%
Mortgage Type
Purchase Money Mortgage
Create a Home Valuation Report for This Property
The Home Valuation Report is an in-depth analysis detailing your home's value as well as a comparison with similar homes in the area
Home Values in the Area
Average Home Value in this Area
Purchase History
| Date | Buyer | Sale Price | Title Company |
|---|---|---|---|
| Osiecki Carol M | $269,900 | -- | |
| Leonard Terence J | $177,000 | -- |
Source: Public Records
Mortgage History
| Date | Status | Borrower | Loan Amount |
|---|---|---|---|
| Open | Osiecki Carol M | $242,910 | |
| Previous Owner | Leonard Terence J | $180,500 |
Source: Public Records
Tax History
| Year | Tax Paid | Tax Assessment Tax Assessment Total Assessment is a certain percentage of the fair market value that is determined by local assessors to be the total taxable value of land and additions on the property. | Land | Improvement |
|---|---|---|---|---|
| 2025 | $50 | $371,600 | $176,600 | $195,000 |
| 2024 | $5,021 | $357,900 | $167,400 | $190,500 |
| 2023 | $4,875 | $357,900 | $167,400 | $190,500 |
| 2022 | $4,881 | $308,700 | $139,500 | $169,200 |
| 2021 | $4,234 | $252,300 | $126,500 | $125,800 |
| 2020 | $4,425 | $250,000 | $124,000 | $126,000 |
| 2019 | $4,569 | $254,000 | $124,000 | $130,000 |
| 2018 | $4,671 | $251,800 | $124,000 | $127,800 |
| 2017 | $3,860 | $223,400 | $124,000 | $99,400 |
| 2016 | $3,968 | $231,900 | $124,000 | $107,900 |
| 2015 | $3,534 | $215,900 | $112,800 | $103,100 |
Source: Public Records
Map
Nearby Homes
Your Personal Tour Guide
Ask me questions while you tour the home.