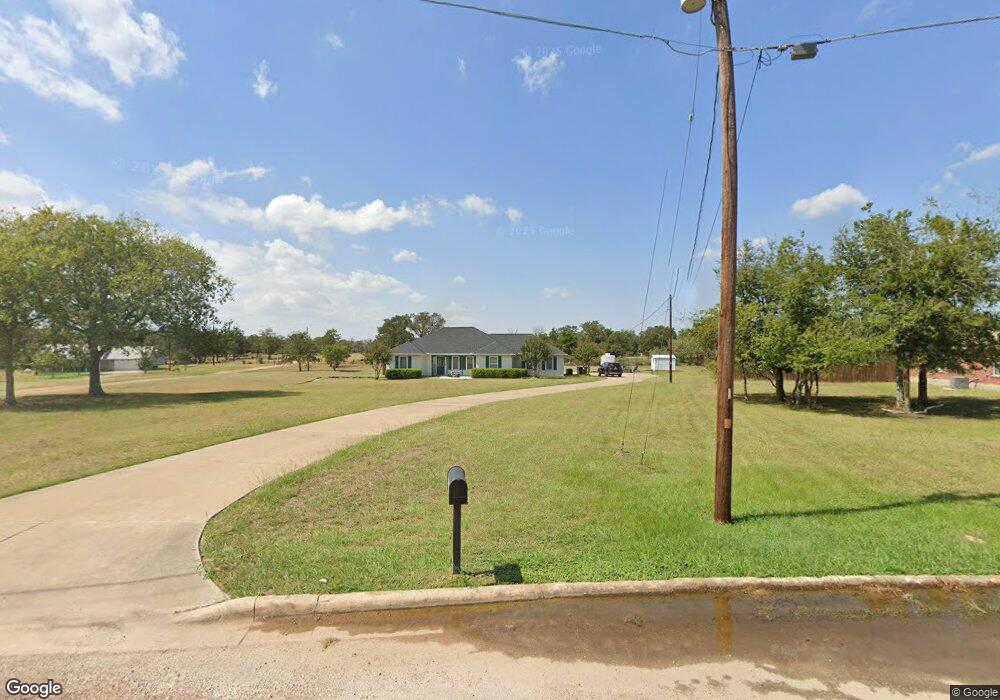
150 W Oak Loop Cedar Creek, TX 78612
Estimated Value: $426,000 - $603,000
--
Bed
--
Bath
2,768
Sq Ft
$183/Sq Ft
Est. Value
About This Home
This home is located at 150 W Oak Loop, Cedar Creek, TX 78612 and is currently estimated at $507,370, approximately $183 per square foot. 150 W Oak Loop is a home located in Bastrop County with nearby schools including Bluebonnet Elementary School, Cedar Creek Middle School, and Cedar Creek Intermediate School.
Ownership History
Date
Name
Owned For
Owner Type
Purchase Details
Closed on
Nov 7, 2024
Sold by
Prado Jesse L and Prado Norma H
Bought by
Running Deer 1 Series and Deer Run Ventures Llc
Current Estimated Value
Purchase Details
Closed on
Aug 30, 2021
Sold by
Properties Group Inc
Bought by
Yanala Kiranmayee
Home Financials for this Owner
Home Financials are based on the most recent Mortgage that was taken out on this home.
Original Mortgage
$345,872
Interest Rate
2.8%
Mortgage Type
New Conventional
Purchase Details
Closed on
May 30, 2014
Sold by
Morris Deborah L
Bought by
Prado Jesse L and Prado Norma
Home Financials for this Owner
Home Financials are based on the most recent Mortgage that was taken out on this home.
Original Mortgage
$48,800
Interest Rate
4.32%
Mortgage Type
Purchase Money Mortgage
Create a Home Valuation Report for This Property
The Home Valuation Report is an in-depth analysis detailing your home's value as well as a comparison with similar homes in the area
Home Values in the Area
Average Home Value in this Area
Purchase History
| Date | Buyer | Sale Price | Title Company |
|---|---|---|---|
| Running Deer 1 Series | -- | None Listed On Document | |
| Running Deer 1 Series | -- | None Listed On Document | |
| Jesse And Norma Prado Family Revocable Living | -- | None Listed On Document | |
| Yanala Kiranmayee | -- | Platinum Title | |
| Prado Jesse L | -- | Austin Title Company |
Source: Public Records
Mortgage History
| Date | Status | Borrower | Loan Amount |
|---|---|---|---|
| Previous Owner | Yanala Kiranmayee | $345,872 | |
| Previous Owner | Prado Jesse L | $48,800 |
Source: Public Records
Tax History
| Year | Tax Paid | Tax Assessment Tax Assessment Total Assessment is a certain percentage of the fair market value that is determined by local assessors to be the total taxable value of land and additions on the property. | Land | Improvement |
|---|---|---|---|---|
| 2025 | $5,834 | $469,155 | $160,000 | $309,155 |
| 2023 | $5,834 | $404,916 | $0 | $0 |
| 2022 | $5,901 | $368,105 | $0 | $0 |
| 2021 | $6,629 | $342,342 | $75,000 | $267,342 |
| 2020 | $6,209 | $341,146 | $51,998 | $289,148 |
| 2019 | $5,866 | $276,563 | $35,000 | $241,563 |
| 2018 | $5,685 | $268,050 | $35,000 | $233,050 |
| 2017 | $5,644 | $253,211 | $38,500 | $214,711 |
| 2016 | $5,445 | $244,268 | $35,000 | $226,591 |
| 2015 | $4,241 | $222,062 | $35,000 | $187,062 |
| 2014 | $4,241 | $206,501 | $35,000 | $182,077 |
Source: Public Records
Map
Nearby Homes
- 141 N Eskew Ln
- TBD McDonald (R93363) Ln
- 356 Cedar Ln
- 323 Cedar Ln
- 201 Fawn Ridge Rd
- 681 Leisure Ln
- 145 Angelia Dr
- 175 Fawn Ridge Rd
- 010 Fawn Ridge Rd
- 000 Fawn Ridge Rd
- TBD White Tail Dr
- 130 La Paz Place
- 222 Pope Bend N
- Donley Plan at Double Eagle Ranch - Riverbend at Double Eagle
- 141 Ayres Horn
- Starr Plan at Double Eagle Ranch - Riverbend at Double Eagle
- Martin Plan at Double Eagle Ranch - Riverbend at Double Eagle
- Ellis Plan at Double Eagle Ranch - Riverbend at Double Eagle
- Young Plan at Double Eagle Ranch - Riverbend at Double Eagle
- Moore Plan at Double Eagle Ranch - Riverbend at Double Eagle
Your Personal Tour Guide
Ask me questions while you tour the home.