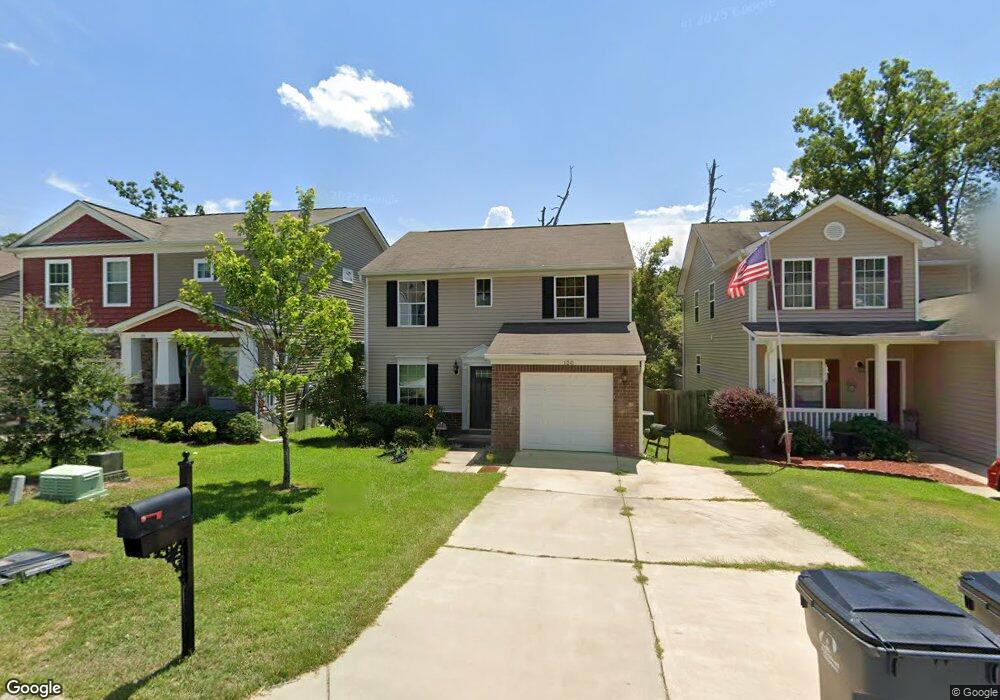
150 Walkbridge Way Chapin, SC 29036
Estimated Value: $234,000 - $266,000
3
Beds
3
Baths
1,520
Sq Ft
$165/Sq Ft
Est. Value
About This Home
This home is located at 150 Walkbridge Way, Chapin, SC 29036 and is currently estimated at $250,188, approximately $164 per square foot. 150 Walkbridge Way is a home located in Lexington County with nearby schools including Chapin Elementary School, Chapin Intermediate, and Chapin High School.
Ownership History
Date
Name
Owned For
Owner Type
Purchase Details
Closed on
Oct 26, 2016
Sold by
Pac Management Llc
Bought by
Mar Tin Rachel G
Current Estimated Value
Home Financials for this Owner
Home Financials are based on the most recent Mortgage that was taken out on this home.
Original Mortgage
$135,988
Outstanding Balance
$109,449
Interest Rate
3.5%
Mortgage Type
FHA
Estimated Equity
$140,739
Purchase Details
Closed on
Jul 5, 2013
Sold by
Coghlan Phillip A
Bought by
Pac Management Llc
Purchase Details
Closed on
Mar 1, 2012
Sold by
Nvr Inc
Bought by
Coghlan Philip A
Home Financials for this Owner
Home Financials are based on the most recent Mortgage that was taken out on this home.
Original Mortgage
$77,400
Interest Rate
3.16%
Mortgage Type
Future Advance Clause Open End Mortgage
Purchase Details
Closed on
Dec 16, 2011
Sold by
Five Star Development Llc
Bought by
Nvr Inc
Create a Home Valuation Report for This Property
The Home Valuation Report is an in-depth analysis detailing your home's value as well as a comparison with similar homes in the area
Home Values in the Area
Average Home Value in this Area
Purchase History
| Date | Buyer | Sale Price | Title Company |
|---|---|---|---|
| Mar Tin Rachel G | -- | None Available | |
| Pac Management Llc | -- | -- | |
| Coghlan Philip A | $103,200 | -- | |
| Nvr Inc | $17,000 | -- |
Source: Public Records
Mortgage History
| Date | Status | Borrower | Loan Amount |
|---|---|---|---|
| Open | Mar Tin Rachel G | $135,988 | |
| Previous Owner | Coghlan Philip A | $77,400 |
Source: Public Records
Tax History Compared to Growth
Tax History
| Year | Tax Paid | Tax Assessment Tax Assessment Total Assessment is a certain percentage of the fair market value that is determined by local assessors to be the total taxable value of land and additions on the property. | Land | Improvement |
|---|---|---|---|---|
| 2024 | $571 | $5,703 | $1,000 | $4,703 |
| 2023 | $480 | $5,703 | $1,000 | $4,703 |
| 2022 | $499 | $5,703 | $1,000 | $4,703 |
| 2020 | $527 | $5,703 | $1,000 | $4,703 |
| 2019 | $512 | $5,540 | $800 | $4,740 |
| 2018 | $444 | $5,540 | $800 | $4,740 |
| 2017 | $428 | $5,540 | $800 | $4,740 |
| 2016 | $191 | $5,653 | $1,200 | $4,453 |
| 2015 | $2,414 | $5,653 | $1,200 | $4,453 |
| 2014 | $2,414 | $6,192 | $1,200 | $4,992 |
| 2013 | -- | $6,190 | $1,200 | $4,990 |
Source: Public Records
Map
Nearby Homes
- 100 Palm St
- 117 Bay Front Dr
- 0 Dreher Island Rd Unit 21647709
- 0 Dreher Island Rd Unit 587193
- 510 Lilypad Ct
- 171 Elm Creek Dr
- 409 Dutchman Shores Cir
- 3006 Chilmark Rd
- 814 Dutchmaster Dr
- 1431 Saugus Ct
- 125 Northshore Dr
- 161 Dutchman Shores Cir
- 129 Monroe Preserve Dr
- 147 Ventnor Ave
- 108 Pennsylvania Ct
- 147 Stuck's Point
- 0 Mainsail Ln Unit 622256
- 100 Baltic Ct
- 417 Northshore Ct
- 412 Northshore Ct
- 146 Walkbridge Way
- 154 Walkbridge Way
- 142 Walkbridge Way
- 158 Walkbridge Way
- 138 Walkbridge Way
- 162 Walkbridge Way
- 1 Walkbridge Ct
- 166 Walkbridge Way
- 134 Walkbridge Way
- 145 Walkbridge Way
- 139 Walkbridge Way
- 130 Walkbridge Way
- 5 Walkbridge Ct
- 133 Walkbridge Way
- 170 Walkbridge Way
- 126 Walkbridge Way
- 127 Walkbridge Way
- 9 Walkbridge Ct
- 178 Walkbridge Way
- 122 Walkbridge Way