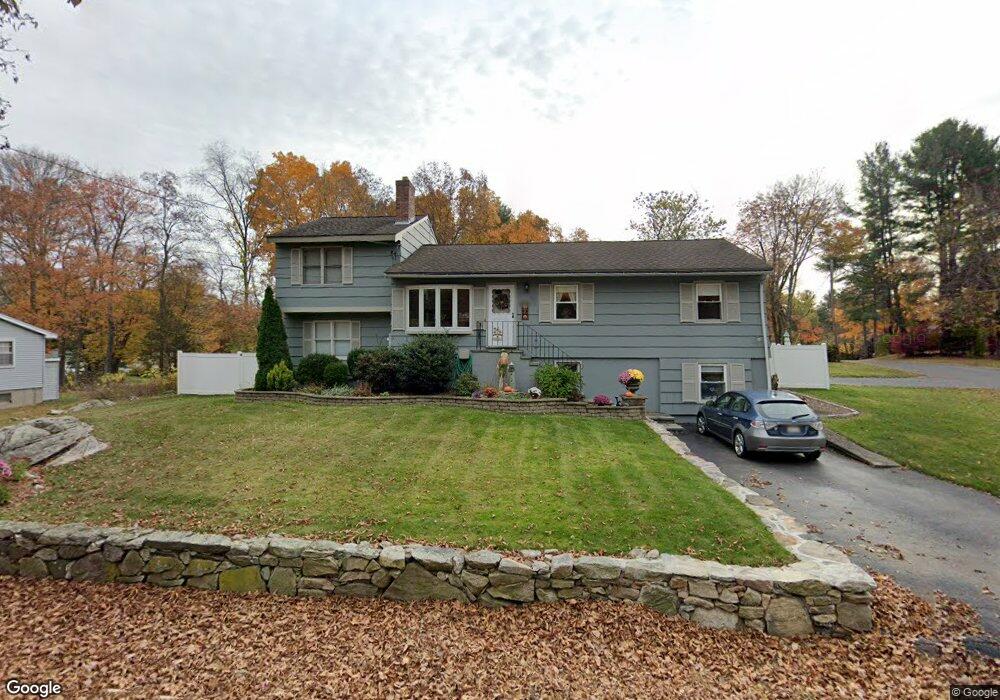
150 Woodland Rd Southborough, MA 01772
Estimated Value: $223,000 - $753,000
5
Beds
3
Baths
1,700
Sq Ft
$352/Sq Ft
Est. Value
About This Home
This home is located at 150 Woodland Rd, Southborough, MA 01772 and is currently estimated at $598,202, approximately $351 per square foot. 150 Woodland Rd is a home located in Worcester County with nearby schools including Albert S. Woodward Memorial School, Margaret A. Neary School, and P. Brent Trottier Middle School.
Ownership History
Date
Name
Owned For
Owner Type
Purchase Details
Closed on
Apr 20, 1989
Sold by
Foley Alice M
Bought by
Foley Alice M
Current Estimated Value
Home Financials for this Owner
Home Financials are based on the most recent Mortgage that was taken out on this home.
Original Mortgage
$97,000
Interest Rate
10.97%
Create a Home Valuation Report for This Property
The Home Valuation Report is an in-depth analysis detailing your home's value as well as a comparison with similar homes in the area
Home Values in the Area
Average Home Value in this Area
Purchase History
| Date | Buyer | Sale Price | Title Company |
|---|---|---|---|
| Foley Alice M | $80,000 | -- | |
| Foley Alice M | $80,000 | -- |
Source: Public Records
Mortgage History
| Date | Status | Borrower | Loan Amount |
|---|---|---|---|
| Open | Foley Alice M | $25,000 | |
| Open | Foley Alice M | $102,000 | |
| Closed | Foley Alice M | $116,000 | |
| Closed | Foley Alice M | $97,000 |
Source: Public Records
Tax History Compared to Growth
Tax History
| Year | Tax Paid | Tax Assessment Tax Assessment Total Assessment is a certain percentage of the fair market value that is determined by local assessors to be the total taxable value of land and additions on the property. | Land | Improvement |
|---|---|---|---|---|
| 2025 | $7,760 | $561,900 | $262,900 | $299,000 |
| 2024 | $7,439 | $534,800 | $262,900 | $271,900 |
| 2023 | $7,290 | $493,900 | $244,100 | $249,800 |
| 2022 | $7,124 | $437,600 | $216,400 | $221,200 |
| 2021 | $3 | $396,000 | $200,300 | $195,700 |
| 2020 | $6,337 | $380,400 | $185,100 | $195,300 |
| 2019 | $6,062 | $362,100 | $173,300 | $188,800 |
| 2018 | $5,636 | $349,200 | $168,600 | $180,600 |
| 2017 | $5,414 | $330,500 | $168,600 | $161,900 |
| 2016 | $5,246 | $331,600 | $167,700 | $163,900 |
| 2015 | $5,235 | $326,800 | $152,100 | $174,700 |
Source: Public Records
Map
Nearby Homes