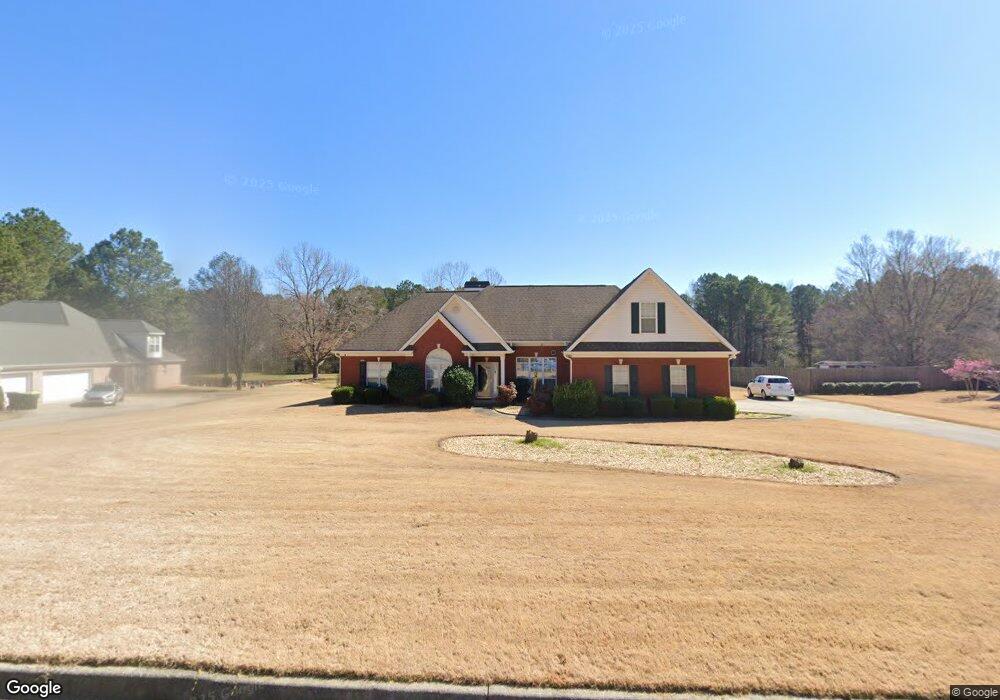
150 Zoie Ct Fayetteville, GA 30215
Estimated Value: $380,000 - $536,000
--
Bed
4
Baths
2,590
Sq Ft
$184/Sq Ft
Est. Value
About This Home
This home is located at 150 Zoie Ct, Fayetteville, GA 30215 and is currently estimated at $476,976, approximately $184 per square foot. 150 Zoie Ct is a home located in Fayette County with nearby schools including Inman Elementary School, Bennett's Mill Middle School, and Fayette County High School.
Ownership History
Date
Name
Owned For
Owner Type
Purchase Details
Closed on
Nov 3, 2019
Sold by
Carr Esperanza
Bought by
Carr Esperanza and Carr Dale W
Current Estimated Value
Home Financials for this Owner
Home Financials are based on the most recent Mortgage that was taken out on this home.
Original Mortgage
$193,563
Outstanding Balance
$168,752
Interest Rate
3.65%
Mortgage Type
VA
Estimated Equity
$308,224
Purchase Details
Closed on
Jun 14, 2002
Sold by
Constgruction Beta
Bought by
Carr Esperanza and Carr Dale W
Home Financials for this Owner
Home Financials are based on the most recent Mortgage that was taken out on this home.
Original Mortgage
$237,150
Interest Rate
6.77%
Mortgage Type
VA
Purchase Details
Closed on
Dec 5, 2001
Sold by
Wurster Mark
Bought by
Beta Construction
Home Financials for this Owner
Home Financials are based on the most recent Mortgage that was taken out on this home.
Original Mortgage
$161,250
Interest Rate
7.16%
Mortgage Type
New Conventional
Create a Home Valuation Report for This Property
The Home Valuation Report is an in-depth analysis detailing your home's value as well as a comparison with similar homes in the area
Home Values in the Area
Average Home Value in this Area
Purchase History
| Date | Buyer | Sale Price | Title Company |
|---|---|---|---|
| Carr Esperanza | -- | -- | |
| Carr Esperanza | $232,500 | -- | |
| Beta Construction | $24,000 | -- |
Source: Public Records
Mortgage History
| Date | Status | Borrower | Loan Amount |
|---|---|---|---|
| Open | Carr Esperanza | $193,563 | |
| Previous Owner | Carr Esperanza | $237,150 | |
| Previous Owner | Beta Construction | $161,250 |
Source: Public Records
Tax History Compared to Growth
Tax History
| Year | Tax Paid | Tax Assessment Tax Assessment Total Assessment is a certain percentage of the fair market value that is determined by local assessors to be the total taxable value of land and additions on the property. | Land | Improvement |
|---|---|---|---|---|
| 2024 | $3,425 | $153,592 | $43,600 | $109,992 |
| 2023 | $3,017 | $148,280 | $43,600 | $104,680 |
| 2022 | $3,590 | $173,760 | $28,400 | $145,360 |
| 2021 | $3,228 | $133,640 | $12,800 | $120,840 |
| 2020 | $3,534 | $125,800 | $12,800 | $113,000 |
| 2019 | $3,219 | $113,480 | $12,800 | $100,680 |
| 2018 | $3,039 | $106,000 | $12,800 | $93,200 |
| 2017 | $2,924 | $101,640 | $12,800 | $88,840 |
| 2016 | $2,667 | $90,840 | $12,800 | $78,040 |
| 2015 | $2,480 | $83,080 | $12,800 | $70,280 |
| 2014 | -- | $75,920 | $12,800 | $63,120 |
| 2013 | -- | $74,680 | $0 | $0 |
Source: Public Records
Map
Nearby Homes
- 160 Cooper Cove W
- 155 Cooper Cove E
- 145 Cooper Cove E
- 125 Cooper W
- 130 Cooper Cove W
- 120 Cooper Cove W
- 120 Cooper Cove E
- Rosemary II Plan at Riverbend Overlook
- Henry II Plan at Riverbend Overlook
- Emerson II Plan at Riverbend Overlook
- Clarity Plan at Riverbend Overlook
- 62 Homesite Cooper Cove W
- 115 Bre Dr
- 10820 Lees Ct
- 10639 Fitzgerald Rd
- 254 County Line Rd
- 400 Kyle Ct