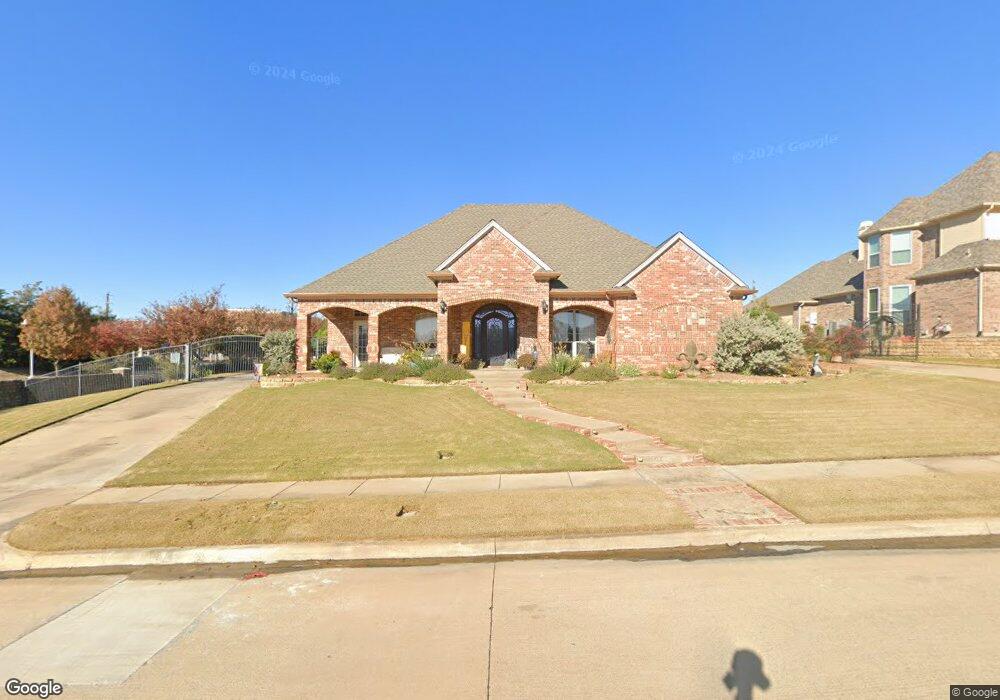
1500 Kingswood Ln Colleyville, TX 76034
Estimated Value: $1,013,000 - $1,198,000
4
Beds
4
Baths
3,545
Sq Ft
$309/Sq Ft
Est. Value
About This Home
This home is located at 1500 Kingswood Ln, Colleyville, TX 76034 and is currently estimated at $1,096,667, approximately $309 per square foot. 1500 Kingswood Ln is a home located in Tarrant County with nearby schools including Colleyville Elementary School, Colleyville Middle School, and Waypoint Montessori.
Ownership History
Date
Name
Owned For
Owner Type
Purchase Details
Closed on
Dec 4, 1998
Sold by
Miller Joe K
Bought by
Matton Ervin M
Current Estimated Value
Home Financials for this Owner
Home Financials are based on the most recent Mortgage that was taken out on this home.
Original Mortgage
$272,000
Interest Rate
6.81%
Purchase Details
Closed on
Dec 23, 1996
Sold by
Yarbrough Gary T
Bought by
Miller Joe K
Home Financials for this Owner
Home Financials are based on the most recent Mortgage that was taken out on this home.
Original Mortgage
$268,800
Interest Rate
7.6%
Purchase Details
Closed on
Dec 20, 1996
Sold by
Mt Properties Inc
Bought by
Yarbrough Gary T
Home Financials for this Owner
Home Financials are based on the most recent Mortgage that was taken out on this home.
Original Mortgage
$268,800
Interest Rate
7.6%
Create a Home Valuation Report for This Property
The Home Valuation Report is an in-depth analysis detailing your home's value as well as a comparison with similar homes in the area
Home Values in the Area
Average Home Value in this Area
Purchase History
| Date | Buyer | Sale Price | Title Company |
|---|---|---|---|
| Matton Ervin M | -- | Alamo Title Co | |
| Miller Joe K | -- | Trinity Western Title Co | |
| Yarbrough Gary T | -- | Lone Star Title Inc |
Source: Public Records
Mortgage History
| Date | Status | Borrower | Loan Amount |
|---|---|---|---|
| Closed | Matton Ervin M | $272,000 | |
| Previous Owner | Miller Joe K | $268,800 |
Source: Public Records
Tax History Compared to Growth
Tax History
| Year | Tax Paid | Tax Assessment Tax Assessment Total Assessment is a certain percentage of the fair market value that is determined by local assessors to be the total taxable value of land and additions on the property. | Land | Improvement |
|---|---|---|---|---|
| 2025 | $2,694 | $899,538 | $257,245 | $642,293 |
| 2024 | $2,694 | $899,538 | $257,245 | $642,293 |
| 2023 | $11,464 | $841,103 | $257,245 | $583,858 |
| 2022 | $12,202 | $742,381 | $257,245 | $485,136 |
| 2021 | $12,335 | $561,665 | $164,490 | $397,175 |
| 2020 | $12,481 | $561,665 | $164,490 | $397,175 |
| 2019 | $13,493 | $612,544 | $164,490 | $448,054 |
| 2018 | $3,154 | $530,537 | $164,490 | $366,047 |
| 2017 | $11,394 | $597,717 | $164,490 | $433,227 |
| 2016 | $10,358 | $547,819 | $161,490 | $386,329 |
| 2015 | $9,039 | $398,600 | $50,000 | $348,600 |
| 2014 | $9,039 | $398,600 | $50,000 | $348,600 |
Source: Public Records
Map
Nearby Homes
- Lot 4 Amelia Ct
- 5317 Bluebonnet Dr
- 1512 Four Seasons Dr
- 5508 Coventry Ct
- 1521 Four Seasons Dr
- 1505 Four Seasons Dr
- 1504 Four Seasons Dr
- 1533 Four Seasons Dr
- 1536 Four Seasons Dr
- 1513 Four Seasons Dr
- Lot 3 Amelia Ct
- 1517 Four Seasons Dr
- 1525 Four Seasons Dr
- 1532 Four Seasons Dr
- 5200 Preservation Ave
- 6005 Valentino Ct
- 5104 Preservation Ave
- 5613 Versailles Ct
- 5404 Miramar Ln
- 1813 Grosvenor Green
- 1502 Kingswood Ln
- 1504 Kingswood Ln
- 1503 Kingswood Ln
- 1506 Kingswood Ln
- 1505 Kingswood Ln
- 1508 Kingswood Ln
- 1507 Kingswood Ln
- 1600 Kingswood Ln
- 1502 Royal Ln
- 1509 Kingswood Ln
- 1504 Royal Ln
- 1506 Royal Ln
- 1602 Kingswood Ln
- 1508 Royal Ln
- 12136 Bellegrove Rd
- 0000 Eastpointe Ct
- 1603 Kingswood Ln
- 1604 Kingswood Ln
- 1600 Royal Ln
- 1501 Royal Ln