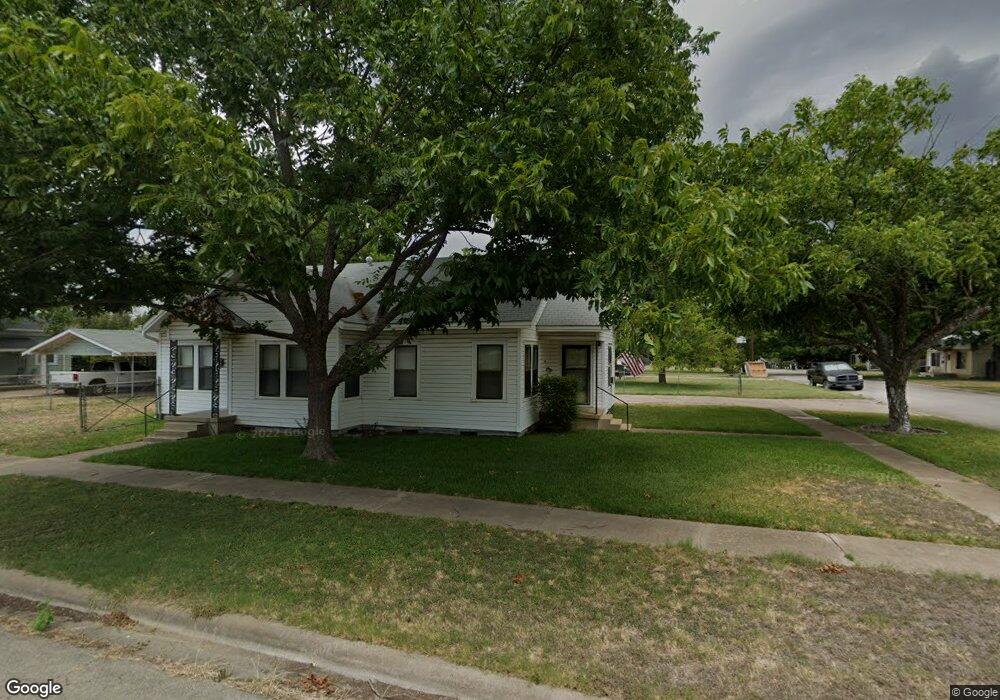
1500 N Main St Temple, TX 76501
Jackson Park District NeighborhoodEstimated Value: $140,000 - $156,000
2
Beds
2
Baths
1,308
Sq Ft
$112/Sq Ft
Est. Value
About This Home
This home is located at 1500 N Main St, Temple, TX 76501 and is currently estimated at $146,350, approximately $111 per square foot. 1500 N Main St is a home located in Bell County with nearby schools including Jefferson Elementary School, Lamar Middle, and Temple High School.
Ownership History
Date
Name
Owned For
Owner Type
Purchase Details
Closed on
Dec 21, 2016
Sold by
Ledger Kay Nan
Bought by
Dunagan Tony M
Current Estimated Value
Home Financials for this Owner
Home Financials are based on the most recent Mortgage that was taken out on this home.
Original Mortgage
$85,222
Outstanding Balance
$68,921
Interest Rate
3.57%
Mortgage Type
New Conventional
Estimated Equity
$77,429
Purchase Details
Closed on
Nov 1, 2012
Sold by
Farrell Dalline and Ledger Kay Nan
Bought by
Farrell Dalline
Create a Home Valuation Report for This Property
The Home Valuation Report is an in-depth analysis detailing your home's value as well as a comparison with similar homes in the area
Home Values in the Area
Average Home Value in this Area
Purchase History
| Date | Buyer | Sale Price | Title Company |
|---|---|---|---|
| Dunagan Tony M | -- | Centrland Title Co | |
| Farrell Dalline | -- | None Available |
Source: Public Records
Mortgage History
| Date | Status | Borrower | Loan Amount |
|---|---|---|---|
| Open | Dunagan Tony M | $85,222 |
Source: Public Records
Tax History
| Year | Tax Paid | Tax Assessment Tax Assessment Total Assessment is a certain percentage of the fair market value that is determined by local assessors to be the total taxable value of land and additions on the property. | Land | Improvement |
|---|---|---|---|---|
| 2025 | $317 | $87,729 | -- | -- |
| 2024 | $317 | $79,754 | -- | -- |
| 2023 | $1,662 | $72,504 | $0 | $0 |
| 2022 | $1,578 | $65,913 | $0 | $0 |
| 2021 | $1,538 | $88,813 | $18,000 | $70,813 |
| 2020 | $1,462 | $91,995 | $18,000 | $73,995 |
| 2019 | $1,353 | $49,522 | $7,740 | $56,250 |
| 2018 | $1,241 | $45,020 | $7,740 | $53,580 |
| 2017 | $1,121 | $40,927 | $7,740 | $33,187 |
| 2016 | $1,008 | $36,799 | $7,740 | $29,059 |
| 2014 | $124 | $36,791 | $0 | $0 |
Source: Public Records
Map
Nearby Homes