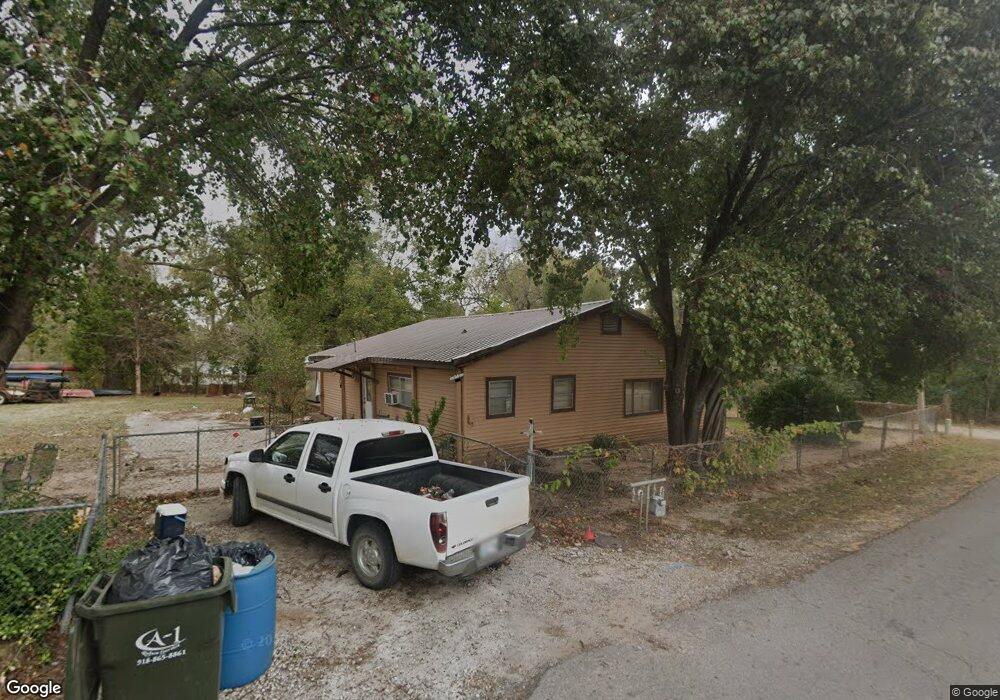
1500 N Sherman Ave Okmulgee, OK 74447
Estimated Value: $40,000 - $158,000
2
Beds
1
Bath
1,106
Sq Ft
$70/Sq Ft
Est. Value
About This Home
This home is located at 1500 N Sherman Ave, Okmulgee, OK 74447 and is currently estimated at $76,930, approximately $69 per square foot. 1500 N Sherman Ave is a home located in Okmulgee County with nearby schools including Okmulgee Primary School, Okmulgee Middle School, and Dunbar Elementary School.
Ownership History
Date
Name
Owned For
Owner Type
Purchase Details
Closed on
Oct 29, 2025
Sold by
Minnis Janet R and Minnis Michael G
Bought by
Burklin James L
Current Estimated Value
Purchase Details
Closed on
Oct 1, 2024
Sold by
Norris Alyssa Marie and Witt Colton
Bought by
Minnis Janet R and Burklin James L
Purchase Details
Closed on
Sep 29, 2020
Sold by
Effinger Michael and Effinger Berta
Bought by
Witt Dana Fay and Witt Colton
Purchase Details
Closed on
Oct 11, 2017
Sold by
Norris Ronald L and Estate Of Jill Leanne Grant
Bought by
Norris Alyssa Marie
Home Financials for this Owner
Home Financials are based on the most recent Mortgage that was taken out on this home.
Original Mortgage
$32,418
Interest Rate
3.78%
Mortgage Type
Commercial
Purchase Details
Closed on
Jul 20, 2017
Sold by
Norris Ronald L and Norris Brenda E
Bought by
Norris Alyssa Marie
Purchase Details
Closed on
Oct 29, 2014
Sold by
Norris Maxine
Bought by
Norris Ronald L and Norris Jill L
Create a Home Valuation Report for This Property
The Home Valuation Report is an in-depth analysis detailing your home's value as well as a comparison with similar homes in the area
Home Values in the Area
Average Home Value in this Area
Purchase History
| Date | Buyer | Sale Price | Title Company |
|---|---|---|---|
| Burklin James L | -- | None Listed On Document | |
| Minnis Janet R | $35,000 | None Listed On Document | |
| Witt Dana Fay | -- | None Available | |
| Norris Alyssa Marie | $15,000 | None Available | |
| Norris Alyssa Marie | -- | None Available | |
| Norris Ronald L | -- | -- |
Source: Public Records
Mortgage History
| Date | Status | Borrower | Loan Amount |
|---|---|---|---|
| Previous Owner | Norris Alyssa Marie | $32,418 |
Source: Public Records
Tax History Compared to Growth
Tax History
| Year | Tax Paid | Tax Assessment Tax Assessment Total Assessment is a certain percentage of the fair market value that is determined by local assessors to be the total taxable value of land and additions on the property. | Land | Improvement |
|---|---|---|---|---|
| 2025 | $385 | $4,200 | $215 | $3,985 |
| 2024 | $333 | $4,682 | $360 | $4,322 |
| 2023 | $313 | $4,682 | $360 | $4,322 |
| 2022 | $311 | $4,682 | $360 | $4,322 |
| 2021 | $326 | $4,682 | $360 | $4,322 |
| 2020 | $326 | $4,691 | $360 | $4,331 |
| 2019 | $314 | $4,554 | $360 | $4,194 |
| 2018 | $388 | $4,337 | $360 | $3,977 |
| 2017 | $366 | $4,131 | $360 | $3,771 |
| 2016 | $349 | $3,934 | $360 | $3,574 |
| 2015 | $342 | $3,971 | $360 | $3,611 |
| 2014 | $119 | $2,370 | $360 | $2,010 |
Source: Public Records
Map
Nearby Homes
- 1401 N Griffin St
- 400 Yuchi Dr
- 0 N Oklahoma Ave
- 1026 N Kern Ave
- 1101 N Collins Ave
- 0 N Sherman Ave
- 1106 N Alabama Ave
- 1824 N Morton Ave
- 1801 N Morton Ave
- 813 N Kern Ave
- 910 N Collins Ave
- 908 N Collins Ave
- 1400 W Seneca St
- 804 N Griffin Ave
- 704 N Sherman Ave
- 700 N Sherman Ave
- 804 N Alabama Ave
- 602 N Collins Ave
- 809 N Grand Ave
- 530 N Okmulgee Ave
- 0 Sherman Ave
- 1503 N Kern Ave
- 1500 N Taft Ave
- 1500 N Taft Ave
- 1419 N Kern Ave
- 1504 N Kern Ave
- 1512 N Taft Ave
- 1418 N Taft Ave
- 1525 N Kern Ave
- 1416 N Kern Ave
- 1410 N Kern Ave
- 1524 N Kern Ave
- 1524 N Taft Ave
- 926 W Kiowa St
- 1011 W Eufaula St
- 1011 W Eufaula Po St
- 1424 N Sherman Ave
- 1301 W Kiowa St
- 1404 N Kern Ave
- 1411 N Monroe Ave