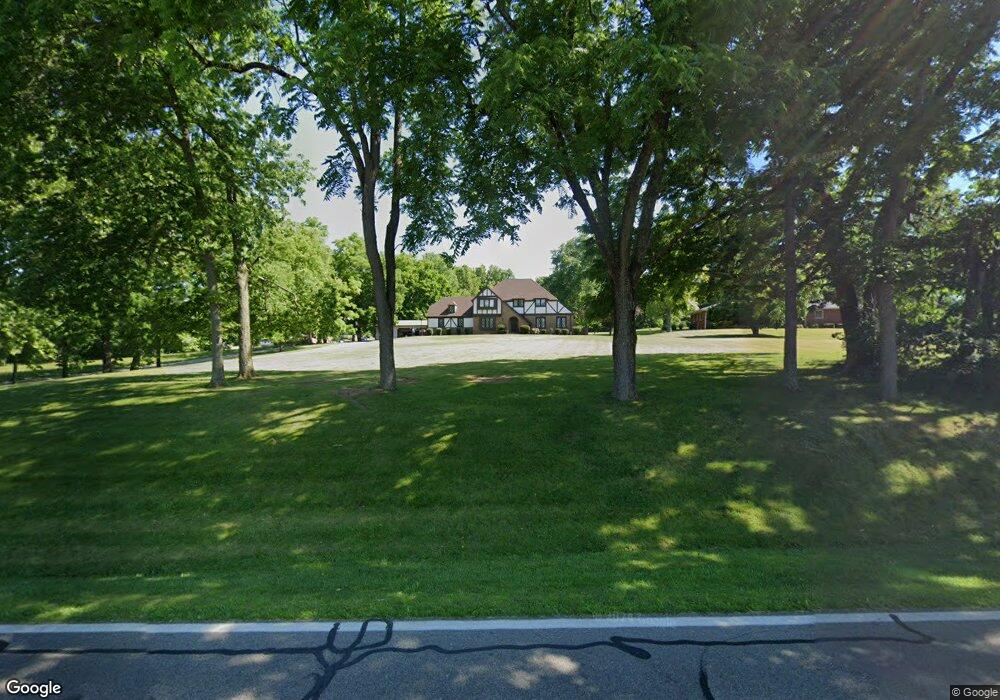
1500 State Route 180 Chillicothe, OH 45601
Estimated Value: $355,000 - $482,000
--
Bed
3
Baths
2,700
Sq Ft
$160/Sq Ft
Est. Value
About This Home
This home is located at 1500 State Route 180, Chillicothe, OH 45601 and is currently estimated at $431,052, approximately $159 per square foot. 1500 State Route 180 is a home located in Ross County with nearby schools including Zane Trace Elementary School, Zane Trace Middle School, and Zane Trace High School.
Ownership History
Date
Name
Owned For
Owner Type
Purchase Details
Closed on
Aug 21, 2015
Sold by
Hanson Cathy and Hoylman Jeff
Bought by
Kerr James and Kerr Belinda L
Current Estimated Value
Home Financials for this Owner
Home Financials are based on the most recent Mortgage that was taken out on this home.
Original Mortgage
$223,250
Outstanding Balance
$88,661
Interest Rate
4.09%
Mortgage Type
New Conventional
Estimated Equity
$342,391
Purchase Details
Closed on
Jan 15, 2015
Bought by
Hanson Cathy Trustee
Home Financials for this Owner
Home Financials are based on the most recent Mortgage that was taken out on this home.
Interest Rate
3.66%
Purchase Details
Closed on
Sep 3, 2014
Bought by
Hoylman Jack F Successor Trust
Home Financials for this Owner
Home Financials are based on the most recent Mortgage that was taken out on this home.
Interest Rate
4.1%
Create a Home Valuation Report for This Property
The Home Valuation Report is an in-depth analysis detailing your home's value as well as a comparison with similar homes in the area
Home Values in the Area
Average Home Value in this Area
Purchase History
| Date | Buyer | Sale Price | Title Company |
|---|---|---|---|
| Kerr James | $235,000 | Chicago Title | |
| Hanson Cathy Trustee | -- | -- | |
| Hoylman Jack F Successor Trust | -- | -- |
Source: Public Records
Mortgage History
| Date | Status | Borrower | Loan Amount |
|---|---|---|---|
| Open | Kerr James | $223,250 | |
| Closed | Hoylman Jack F Successor Trust | -- | |
| Previous Owner | Hoylman Jack F Successor Trust | -- |
Source: Public Records
Tax History Compared to Growth
Tax History
| Year | Tax Paid | Tax Assessment Tax Assessment Total Assessment is a certain percentage of the fair market value that is determined by local assessors to be the total taxable value of land and additions on the property. | Land | Improvement |
|---|---|---|---|---|
| 2024 | $4,071 | $110,420 | $6,580 | $103,840 |
| 2023 | $4,071 | $110,420 | $6,580 | $103,840 |
| 2022 | $4,154 | $110,420 | $6,580 | $103,840 |
| 2021 | $3,002 | $80,980 | $4,930 | $76,050 |
| 2020 | $3,000 | $80,980 | $4,930 | $76,050 |
| 2019 | $3,003 | $80,980 | $4,930 | $76,050 |
| 2018 | $2,971 | $77,050 | $4,650 | $72,400 |
| 2017 | $3,035 | $77,050 | $4,650 | $72,400 |
| 2016 | $2,959 | $77,050 | $4,650 | $72,400 |
| 2015 | $2,862 | $74,390 | $4,650 | $69,740 |
| 2014 | $2,793 | $74,390 | $4,650 | $69,740 |
| 2013 | $2,806 | $74,390 | $4,650 | $69,740 |
Source: Public Records
Map
Nearby Homes
- 7178 Ohio 159
- 213 Sulphur Spring Rd
- 277 Sulphur Spring Rd
- 0 US Rt 23 Unit 1857559
- 965 Graves Rd
- 4557 Ohio 159
- 20702 Us Highway 23
- 4557 State Route 159
- 268 Clayburne Blvd
- 24 2nd St
- 0 Hospital Rd Unit 198430
- 7183 Kingston Adelphi Rd
- 2133 Dearth Rd
- 527 Jadwin Rd
- 1959 Chapel Creek Rd
- 1086 Thornton-Spung Rd
- 7135 Walnut Creek Rd
- 500 Old Elm Rd
- 2998 Dry Run Rd
- 6328 Ohio 180
- 1505 State Route 180
- 1444 State Route 180
- 1507 State Route 180
- 1517 State Route 180
- 1583 State Route 180
- 1615 State Route 180
- 1641 Ohio 180
- 1641 State Route 180
- 1667 State Route 180
- 1669 State Route 180
- 1226 State Route 180
- 1222 Ohio 180
- 1206 Ohio 180
- 1667 Ohio 180
- 1206 State Route 180
- 1497 State Route 180
- 1040 Ohio 180
- 1033 State Route 180
- 1033 Ohio 180
- 959 State Route 180