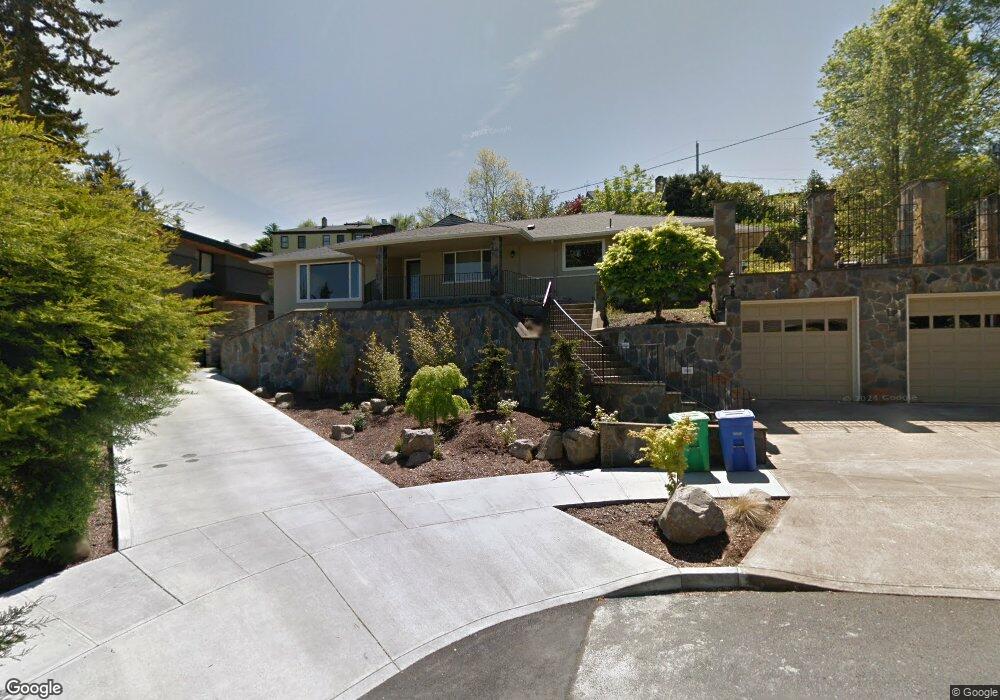
1500 SW Spring St Portland, OR 97201
Southwest Hills NeighborhoodEstimated Value: $1,341,712 - $1,496,000
3
Beds
2
Baths
1,880
Sq Ft
$772/Sq Ft
Est. Value
About This Home
This home is located at 1500 SW Spring St, Portland, OR 97201 and is currently estimated at $1,450,928, approximately $771 per square foot. 1500 SW Spring St is a home located in Multnomah County with nearby schools including Ainsworth Elementary School, West Sylvan Middle School, and Lincoln High School.
Ownership History
Date
Name
Owned For
Owner Type
Purchase Details
Closed on
Jun 22, 2013
Sold by
Lee Michael S
Bought by
Lee Michael S and Yoon Helen S
Current Estimated Value
Home Financials for this Owner
Home Financials are based on the most recent Mortgage that was taken out on this home.
Original Mortgage
$592,000
Outstanding Balance
$132,819
Interest Rate
3.48%
Mortgage Type
New Conventional
Estimated Equity
$1,318,109
Purchase Details
Closed on
Feb 12, 2013
Sold by
Lee Michael S
Bought by
Lee Michael S and Yoon Helen S
Purchase Details
Closed on
Jul 24, 2006
Sold by
Hahn Charles
Bought by
Lee Michael S and Yoon Helen S
Home Financials for this Owner
Home Financials are based on the most recent Mortgage that was taken out on this home.
Original Mortgage
$648,000
Interest Rate
6.57%
Mortgage Type
Purchase Money Mortgage
Purchase Details
Closed on
Sep 14, 1998
Sold by
Caskey Frances M
Bought by
Hahn Charles and Hahn Gwen
Create a Home Valuation Report for This Property
The Home Valuation Report is an in-depth analysis detailing your home's value as well as a comparison with similar homes in the area
Home Values in the Area
Average Home Value in this Area
Purchase History
| Date | Buyer | Sale Price | Title Company |
|---|---|---|---|
| Lee Michael S | -- | Accommodation | |
| Lee Michael S | -- | First American | |
| Lee Michael S | -- | None Available | |
| Lee Michael S | $810,000 | Fidelity Natl Title Co Of Or | |
| Hahn Charles | $625,000 | Oregon Title Insurance Co |
Source: Public Records
Mortgage History
| Date | Status | Borrower | Loan Amount |
|---|---|---|---|
| Open | Lee Michael S | $592,000 | |
| Closed | Lee Michael S | $648,000 |
Source: Public Records
Tax History Compared to Growth
Tax History
| Year | Tax Paid | Tax Assessment Tax Assessment Total Assessment is a certain percentage of the fair market value that is determined by local assessors to be the total taxable value of land and additions on the property. | Land | Improvement |
|---|---|---|---|---|
| 2024 | $23,185 | $873,850 | -- | -- |
| 2023 | $22,460 | $848,400 | $0 | $0 |
| 2022 | $21,974 | $823,690 | $0 | $0 |
| 2021 | $21,602 | $799,700 | $0 | $0 |
| 2020 | $19,816 | $776,410 | $0 | $0 |
| 2019 | $19,087 | $753,800 | $0 | $0 |
| 2018 | $18,525 | $731,850 | $0 | $0 |
| 2017 | $17,755 | $710,540 | $0 | $0 |
| 2016 | $16,248 | $689,850 | $0 | $0 |
| 2015 | $15,821 | $669,760 | $0 | $0 |
| 2014 | $15,583 | $650,260 | $0 | $0 |
Source: Public Records
Map
Nearby Homes
- 1450 SW Davenport St
- 1524 SW Davenport St
- 1837 SW Elm St Unit 1
- 2233 SW 18th Ave
- 0 SW Broadway Dr
- 1205 SW Myrtle Dr
- 1369 SW Broadway Dr
- 0 SW Rivington Dr Unit 24444940
- 1911 SW Myrtle St
- 1299 SW Cardinell Dr
- 1235 SW Myrtle Ct
- 1980 SW Terrace Dr
- 1948 SW Terrace Dr
- 1040 SW Myrtle Dr
- 1136 SW Davenport St
- 1132 SW Broadway Dr
- 1205 SW Cardinell Dr Unit 604
- 1205 SW Cardinell Dr Unit 502
- 1205 SW Cardinell Dr Unit 102
- 1205 SW Cardinell Dr Unit 202
- 1514 SW Spring St
- 1480 SW Spring St
- 1515 SW Elizabeth Ct
- 1553 SW Elizabeth St
- 1524 SW Spring St
- 2420 SW 15th Ave
- 1535 SW Elizabeth Ct
- 1545 SW Elizabeth St
- 1521 SW Spring St
- 2422 SW 16th Ave
- 2408 SW 15th Ave
- 0 SW 15th (S of 2338)
- 1535 SW Elizabeth St
- 1539 SW Elizabeth Ct
- 2412 SW 15th Ave
- 1530 SW Elizabeth Ct
- 2525 SW 16th Ave
- 1601 SW Elizabeth St
- 1536 SW Elizabeth Ct
- 1449 SW Davenport St