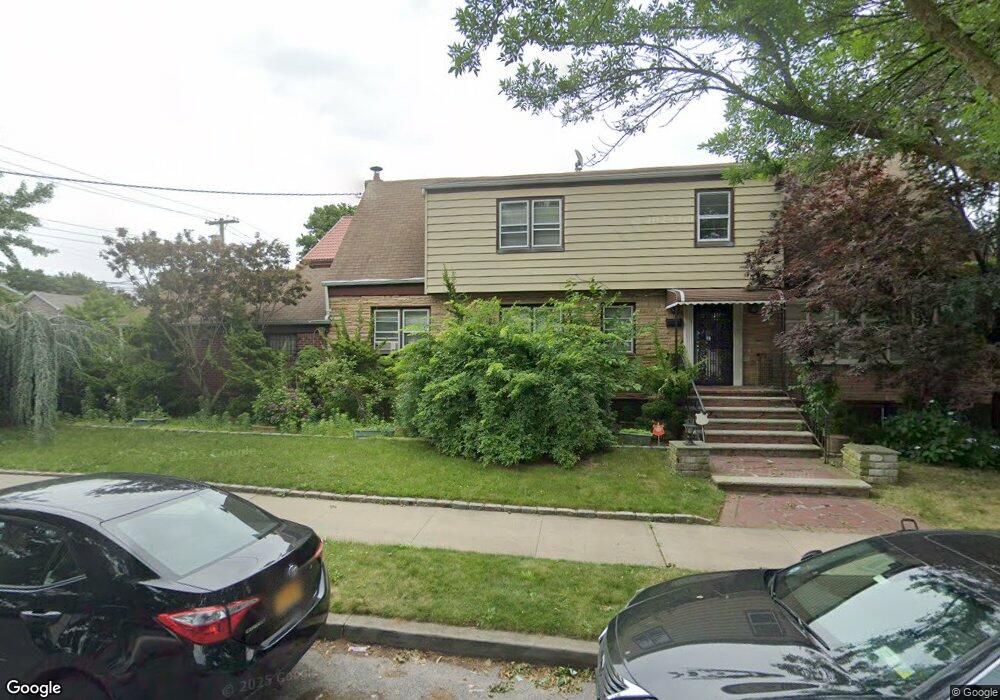
15005 116th St South Ozone Park, NY 11420
South Ozone Park NeighborhoodEstimated Value: $895,924 - $1,193,000
--
Bed
--
Bath
1,623
Sq Ft
$667/Sq Ft
Est. Value
About This Home
This home is located at 15005 116th St, South Ozone Park, NY 11420 and is currently estimated at $1,081,731, approximately $666 per square foot. 15005 116th St is a home located in Queens County with nearby schools including Ps 124 Osmond A Church, J.H.S. 226 Virgil I. Grisson, and John Adams High School.
Ownership History
Date
Name
Owned For
Owner Type
Purchase Details
Closed on
Mar 3, 2020
Sold by
Estate Of Doris Jones Deceased
Bought by
Jones Joseph M and Mack Odell S
Current Estimated Value
Purchase Details
Closed on
May 4, 2001
Sold by
Shemesh Eran
Bought by
Jones Doris
Home Financials for this Owner
Home Financials are based on the most recent Mortgage that was taken out on this home.
Original Mortgage
$350,000
Interest Rate
6.99%
Purchase Details
Closed on
Apr 25, 2000
Sold by
Alaska Seaboard Partners Ltd Partnership
Bought by
Samra Jacob
Home Financials for this Owner
Home Financials are based on the most recent Mortgage that was taken out on this home.
Original Mortgage
$186,300
Interest Rate
8.5%
Purchase Details
Closed on
Mar 20, 2000
Sold by
Kamrudeen Azeem
Bought by
Alaska Seabord Partners Lp
Home Financials for this Owner
Home Financials are based on the most recent Mortgage that was taken out on this home.
Original Mortgage
$186,300
Interest Rate
8.5%
Create a Home Valuation Report for This Property
The Home Valuation Report is an in-depth analysis detailing your home's value as well as a comparison with similar homes in the area
Home Values in the Area
Average Home Value in this Area
Purchase History
| Date | Buyer | Sale Price | Title Company |
|---|---|---|---|
| Jones Joseph M | -- | -- | |
| Jones Doris | -- | -- | |
| Shemesh Eran | -- | -- | |
| Samra Jacob | $200,000 | Titleserv | |
| Alaska Seabord Partners Lp | $1,000 | Titleserv |
Source: Public Records
Mortgage History
| Date | Status | Borrower | Loan Amount |
|---|---|---|---|
| Previous Owner | Shemesh Eran | $350,000 | |
| Previous Owner | Samra Jacob | $186,300 |
Source: Public Records
Tax History Compared to Growth
Tax History
| Year | Tax Paid | Tax Assessment Tax Assessment Total Assessment is a certain percentage of the fair market value that is determined by local assessors to be the total taxable value of land and additions on the property. | Land | Improvement |
|---|---|---|---|---|
| 2025 | $9,749 | $50,285 | $9,438 | $40,847 |
| 2024 | $9,749 | $48,540 | $9,995 | $38,545 |
| 2023 | $9,197 | $45,792 | $10,335 | $35,457 |
| 2022 | $8,624 | $43,200 | $11,700 | $31,500 |
| 2021 | $8,819 | $42,540 | $11,700 | $30,840 |
| 2020 | $8,870 | $46,740 | $11,700 | $35,040 |
| 2019 | $8,700 | $43,080 | $11,700 | $31,380 |
| 2018 | $7,998 | $39,235 | $9,108 | $30,127 |
| 2017 | $7,533 | $37,015 | $10,920 | $26,095 |
| 2016 | $2,869 | $37,015 | $10,920 | $26,095 |
| 2015 | $1,902 | $37,200 | $12,840 | $24,360 |
| 2014 | $1,902 | $36,338 | $12,706 | $23,632 |
Source: Public Records
Map
Nearby Homes
- 150-24 117th St
- 149-27 114th St
- 12104 150th Ave
- 11514 135th Ave
- 11512 135th Ave
- 117-10 135th Ave
- 12114 149th Ave
- 121-14 149 Ave
- 13336 114th Place
- 135-28 122nd St
- 133-24 118th St
- 13512 122nd Place
- 130-55 116th St
- 13344 122nd St
- 157-11 101st St
- 12403 152nd Ave
- 150-33 Hawtree St
- 150-29 Hawtree St
- 150-25 Hawtree St
- 135-56 124th St
- 150-15 116th St Unit 2
- 11606 150th Ave
- 15011 116th St
- 11612 150th Ave
- 115-18 150th Ave
- 11518 150th Ave
- 15015 116th St
- 11616 150th Ave
- 116-07 150th Ave
- 15014 116th St
- 15012 117th St
- 116-03 150th Ave Unit 2 Fl
- 116-03 150th Ave Unit 2
- 116-03 150th Ave
- 116-03 150th Ave Unit 116-03
- 11603 150th Ave Unit 2 Fl
- 15019 116th St
- 150-02 150th Ave
- 150-19 116 St
- 116-05 150th Ave Unit 1st fl