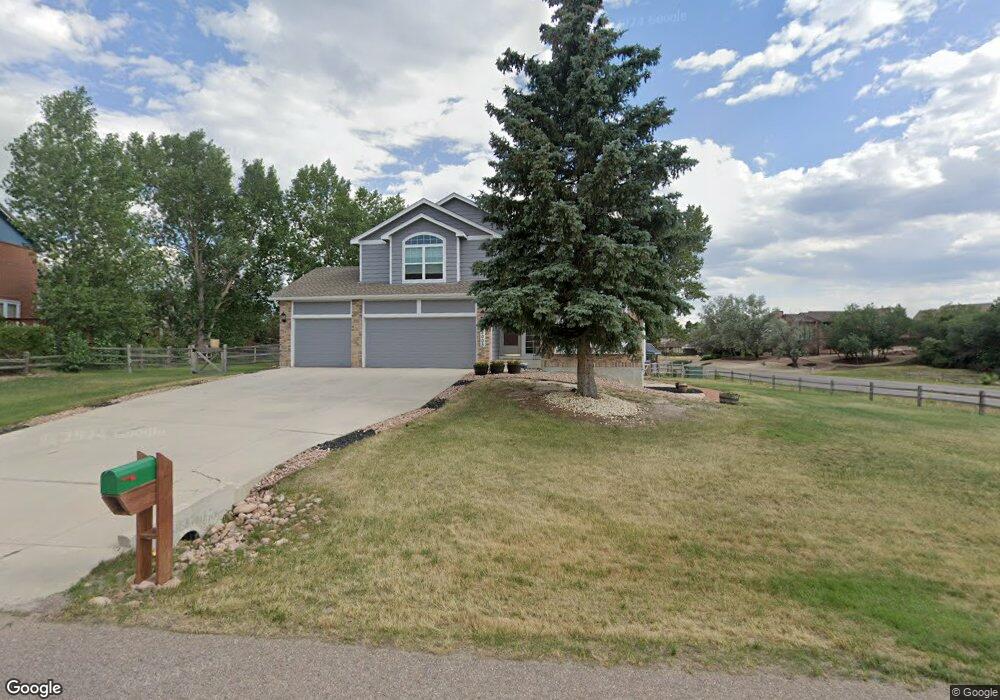
15005 Hilton Head Ct Colorado Springs, CO 80921
Gleneagle NeighborhoodEstimated Value: $694,567 - $764,000
5
Beds
4
Baths
2,924
Sq Ft
$245/Sq Ft
Est. Value
About This Home
This home is located at 15005 Hilton Head Ct, Colorado Springs, CO 80921 and is currently estimated at $716,142, approximately $244 per square foot. 15005 Hilton Head Ct is a home located in El Paso County with nearby schools including Antelope Trails Elementary School, Discovery Canyon Campus Middle School, and Discovery Canyon Campus High School.
Ownership History
Date
Name
Owned For
Owner Type
Purchase Details
Closed on
Dec 30, 2002
Sold by
Vasquez Joseph Paul and Vasquez Marianne
Bought by
Slaman Duane A and Slaman Rebecca A
Current Estimated Value
Home Financials for this Owner
Home Financials are based on the most recent Mortgage that was taken out on this home.
Original Mortgage
$220,000
Outstanding Balance
$93,444
Interest Rate
5.96%
Estimated Equity
$622,698
Purchase Details
Closed on
Jul 28, 1993
Bought by
Slaman Rebecca A
Purchase Details
Closed on
Apr 2, 1993
Bought by
Slaman Rebecca A
Purchase Details
Closed on
Jul 8, 1992
Bought by
Slaman Rebecca A
Purchase Details
Closed on
Jun 26, 1992
Bought by
Slaman Rebecca A
Purchase Details
Closed on
Jun 1, 1992
Bought by
Slaman Rebecca A
Purchase Details
Closed on
Jun 28, 1991
Bought by
Slaman Rebecca A
Purchase Details
Closed on
Nov 27, 1990
Bought by
Slaman Rebecca A
Create a Home Valuation Report for This Property
The Home Valuation Report is an in-depth analysis detailing your home's value as well as a comparison with similar homes in the area
Home Values in the Area
Average Home Value in this Area
Purchase History
| Date | Buyer | Sale Price | Title Company |
|---|---|---|---|
| Slaman Duane A | $275,000 | -- | |
| Slaman Rebecca A | $195,400 | -- | |
| Slaman Rebecca A | $23,000 | -- | |
| Slaman Rebecca A | -- | -- | |
| Slaman Rebecca A | -- | -- | |
| Slaman Rebecca A | $2,850,000 | -- | |
| Slaman Rebecca A | -- | -- | |
| Slaman Rebecca A | -- | -- |
Source: Public Records
Mortgage History
| Date | Status | Borrower | Loan Amount |
|---|---|---|---|
| Open | Slaman Duane A | $220,000 |
Source: Public Records
Tax History Compared to Growth
Tax History
| Year | Tax Paid | Tax Assessment Tax Assessment Total Assessment is a certain percentage of the fair market value that is determined by local assessors to be the total taxable value of land and additions on the property. | Land | Improvement |
|---|---|---|---|---|
| 2025 | $4,032 | $50,760 | -- | -- |
| 2024 | $4,132 | $46,010 | $7,370 | $38,640 |
| 2023 | $4,132 | $46,010 | $7,370 | $38,640 |
| 2022 | $3,582 | $34,090 | $6,950 | $27,140 |
| 2021 | $3,854 | $35,070 | $7,150 | $27,920 |
| 2020 | $3,625 | $31,530 | $6,010 | $25,520 |
| 2019 | $3,600 | $31,530 | $6,010 | $25,520 |
| 2018 | $3,089 | $26,750 | $5,040 | $21,710 |
| 2017 | $3,081 | $26,750 | $5,040 | $21,710 |
| 2016 | $2,481 | $24,710 | $5,010 | $19,700 |
| 2015 | $2,477 | $24,710 | $5,010 | $19,700 |
| 2014 | $2,274 | $22,670 | $5,010 | $17,660 |
Source: Public Records
Map
Nearby Homes
- 270 Rangely Dr
- 410 Palm Springs Way
- 320 Palm Springs Dr
- 240 Wuthering Heights Dr
- 14785 Latrobe Dr
- 15427 Jessie Dr
- 625 Rembrandt Ct
- 15216 Paddington Cir
- 342 Mission Hill Way
- 205 Pauma Valley Dr
- 15450 Holbein Dr
- 308 Mission Hill Way
- 240 Mission Hill Way
- 15350 Ridgefield Ln
- 15616 Soo Line Way
- 14420 Club Villa Dr Unit A
- 14401 Eagle Villa Grove
- 61 Misty Creek Dr
- 14335 Eagle Villa Grove
- 189 Homeland Ct
- 320 Rangely Dr
- 15015 Hilton Head Ct
- 340 Rangely Dr
- 15010 Hilton Head Ct
- 15002 La Jolla Place
- 15003 La Jolla Place
- 15025 Hilton Head Ct
- 290 Rangely Dr
- 15020 Hilton Head Ct
- 325 Rangely Dr
- 360 Rangely Dr
- 15030 Hilton Head Ct
- 15011 La Jolla Place
- 345 Rangely Dr
- 305 Wuthering Heights Dr
- 325 Wuthering Heights Dr
- 285 Rangely Dr
- 14945 Gleneagle Dr
- 15018 La Jolla Place
- 410 Rangely Dr