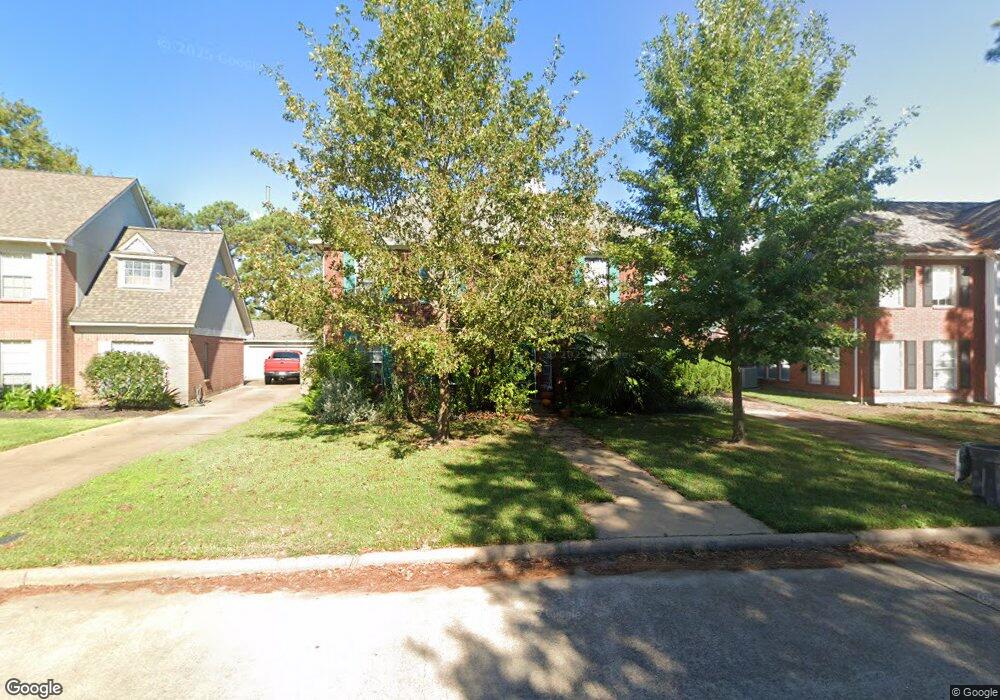
15006 Chetland Place Dr Houston, TX 77095
Copperfield NeighborhoodEstimated Value: $343,000 - $407,992
5
Beds
4
Baths
3,354
Sq Ft
$112/Sq Ft
Est. Value
About This Home
This home is located at 15006 Chetland Place Dr, Houston, TX 77095 and is currently estimated at $374,498, approximately $111 per square foot. 15006 Chetland Place Dr is a home located in Harris County with nearby schools including Owens Elementary School, Labay Middle School, and Cypress Falls High School.
Ownership History
Date
Name
Owned For
Owner Type
Purchase Details
Closed on
May 28, 2015
Sold by
Easterbrook John A and Easterbrook Mary Leah
Bought by
Easterbrook Matthew A
Current Estimated Value
Home Financials for this Owner
Home Financials are based on the most recent Mortgage that was taken out on this home.
Original Mortgage
$136,000
Outstanding Balance
$105,072
Interest Rate
3.68%
Estimated Equity
$269,426
Purchase Details
Closed on
Aug 16, 2000
Sold by
Fiorenza Rev Joseph A
Bought by
Easterbrook John A
Home Financials for this Owner
Home Financials are based on the most recent Mortgage that was taken out on this home.
Original Mortgage
$105,000
Interest Rate
8.22%
Purchase Details
Closed on
Oct 19, 1993
Sold by
Wang Jiann Hwa and Wang Ching Hui
Bought by
Fiorenza Joseph A and St Elizabeth Ann Seton Catholic Cmnty
Create a Home Valuation Report for This Property
The Home Valuation Report is an in-depth analysis detailing your home's value as well as a comparison with similar homes in the area
Home Values in the Area
Average Home Value in this Area
Purchase History
| Date | Buyer | Sale Price | Title Company |
|---|---|---|---|
| Easterbrook Matthew A | -- | Startex Title Co | |
| Easterbrook John A | -- | Stewart Title Company | |
| Fiorenza Joseph A | -- | Texas American Title Company |
Source: Public Records
Mortgage History
| Date | Status | Borrower | Loan Amount |
|---|---|---|---|
| Open | Easterbrook Matthew A | $136,000 | |
| Previous Owner | Easterbrook John A | $105,000 |
Source: Public Records
Tax History Compared to Growth
Tax History
| Year | Tax Paid | Tax Assessment Tax Assessment Total Assessment is a certain percentage of the fair market value that is determined by local assessors to be the total taxable value of land and additions on the property. | Land | Improvement |
|---|---|---|---|---|
| 2025 | $5,066 | $359,402 | $71,521 | $287,881 |
| 2024 | $5,066 | $378,082 | $71,521 | $306,561 |
| 2023 | $5,066 | $354,572 | $71,521 | $283,051 |
| 2022 | $6,779 | $332,713 | $57,139 | $275,574 |
| 2021 | $6,493 | $270,388 | $57,139 | $213,249 |
| 2020 | $6,218 | $251,997 | $40,814 | $211,183 |
| 2019 | $6,138 | $240,882 | $28,189 | $212,693 |
| 2018 | $2,290 | $230,000 | $28,189 | $201,811 |
| 2017 | $5,879 | $240,385 | $28,189 | $212,196 |
| 2016 | $5,367 | $210,000 | $23,257 | $186,743 |
| 2015 | $2,514 | $223,941 | $23,257 | $200,684 |
| 2014 | $2,514 | $201,097 | $19,380 | $181,717 |
Source: Public Records
Map
Nearby Homes
- 15010 Chetland Place Dr
- 14919 Forest Trails Dr
- 15131 New Hastings Dr
- 14931 Inverrary Dr
- 15339 Glenwood Park Dr
- 8211 Riverglade Dr
- 14911 Sandalfoot St
- 7827 Alamar Dr
- 8043 Oceanside Dr
- Highway 6 N & Huffmeister Rd
- 15362 Meadow Village Dr
- 15415 Swan Creek Dr
- 14502 Sandalfoot St
- 14519 Sandalfoot St
- 15414 Swan Creek Dr
- 15611 Meadow Village Dr
- 8023 Carmel Cir
- 7637 Ameswood Rd
- 8203 Green Devon Dr
- 7921 Capri Cir
- 15002 Chetland Place Dr
- 14918R Chetland Place Dr
- 15014 Chetland Place Dr
- 14918 Chetland Place Dr
- 8223 Megan Place Dr
- 15015 Chetland Place Dr
- 15018 Chetland Place Dr
- 8219 Megan Place Dr
- 15019 Chetland Place Dr
- 14910 Chetland Place Dr
- 8218 Megan Place Dr
- 15022 Chetland Place Dr
- 8134 Brighton Place Ct
- 8215 Megan Place Dr
- 8130 Brighton Place Ct
- 8130 Brighton Pl Ct
- 15023 Chetland Place Dr
- 15026 Chetland Place Dr
- 8214 Megan Place Dr
- 14906 Chetland Place Dr