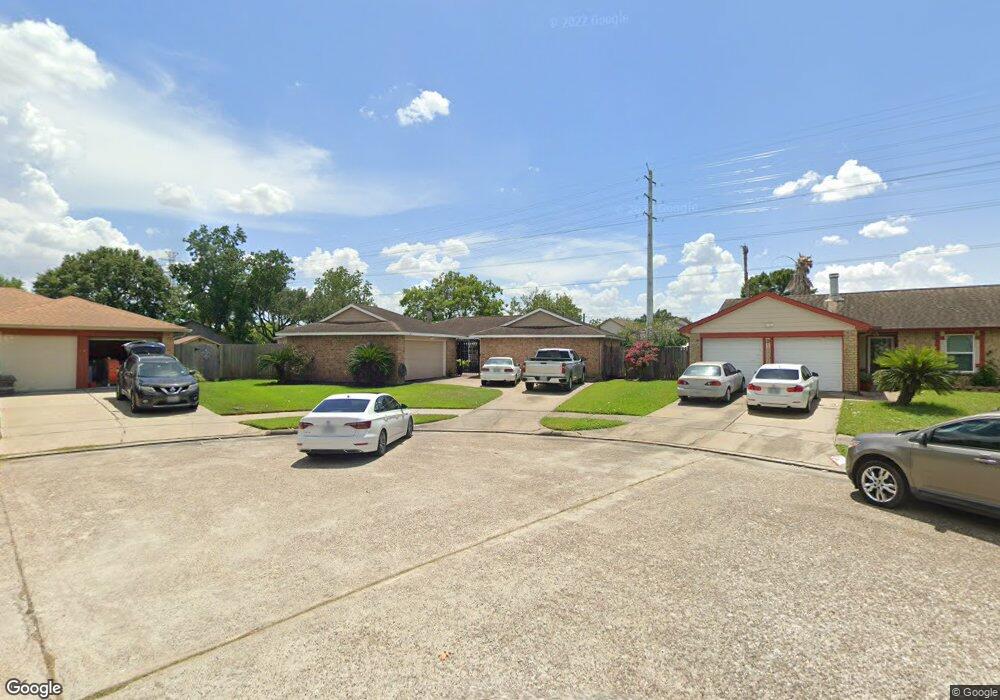
15006 Peachmeadow Ln Channelview, TX 77530
Estimated Value: $204,000 - $218,000
3
Beds
2
Baths
1,538
Sq Ft
$138/Sq Ft
Est. Value
About This Home
This home is located at 15006 Peachmeadow Ln, Channelview, TX 77530 and is currently estimated at $212,927, approximately $138 per square foot. 15006 Peachmeadow Ln is a home located in Harris County with nearby schools including Channelview High School, Family Christian Academy, and Creative Corner.
Ownership History
Date
Name
Owned For
Owner Type
Purchase Details
Closed on
Feb 4, 2003
Sold by
Green Roderic and Green Martha Janet
Bought by
Pizano Pedro
Current Estimated Value
Home Financials for this Owner
Home Financials are based on the most recent Mortgage that was taken out on this home.
Original Mortgage
$72,800
Interest Rate
5.65%
Mortgage Type
Purchase Money Mortgage
Purchase Details
Closed on
Jul 13, 1999
Sold by
Hud
Bought by
Cortina Jose A
Home Financials for this Owner
Home Financials are based on the most recent Mortgage that was taken out on this home.
Original Mortgage
$50,779
Interest Rate
7.39%
Purchase Details
Closed on
May 5, 1998
Sold by
Bellomy Steven P and Bellomy Lydia R
Bought by
Union Planters Bank Na
Purchase Details
Closed on
Dec 6, 1994
Sold by
Yelder George Rufus
Bought by
Yelder Debbye Morris
Create a Home Valuation Report for This Property
The Home Valuation Report is an in-depth analysis detailing your home's value as well as a comparison with similar homes in the area
Home Values in the Area
Average Home Value in this Area
Purchase History
| Date | Buyer | Sale Price | Title Company |
|---|---|---|---|
| Pizano Pedro | -- | Chicago Title Insurance Co | |
| Cortina Jose A | -- | -- | |
| Union Planters Bank Na | $62,355 | -- | |
| Yelder Debbye Morris | -- | Texas American Title Company |
Source: Public Records
Mortgage History
| Date | Status | Borrower | Loan Amount |
|---|---|---|---|
| Previous Owner | Pizano Pedro | $72,800 | |
| Previous Owner | Cortina Jose A | $50,779 | |
| Closed | Pizano Pedro | $13,650 |
Source: Public Records
Tax History Compared to Growth
Tax History
| Year | Tax Paid | Tax Assessment Tax Assessment Total Assessment is a certain percentage of the fair market value that is determined by local assessors to be the total taxable value of land and additions on the property. | Land | Improvement |
|---|---|---|---|---|
| 2025 | $2,970 | $205,677 | $42,788 | $162,889 |
| 2024 | $2,970 | $208,936 | $42,788 | $166,148 |
| 2023 | $2,970 | $214,877 | $42,788 | $172,089 |
| 2022 | $4,064 | $188,912 | $42,788 | $146,124 |
| 2021 | $3,913 | $165,211 | $42,788 | $122,423 |
| 2020 | $3,888 | $145,354 | $42,788 | $102,566 |
| 2019 | $3,674 | $140,391 | $35,921 | $104,470 |
| 2018 | $1,281 | $126,479 | $33,613 | $92,866 |
| 2017 | $3,103 | $126,479 | $33,613 | $92,866 |
| 2016 | $2,821 | $105,758 | $26,890 | $78,868 |
| 2015 | $2,167 | $93,870 | $15,462 | $78,408 |
| 2014 | $2,167 | $87,431 | $12,773 | $74,658 |
Source: Public Records
Map
Nearby Homes
- 1423 Seafield Dr
- 14854 Shottery Dr
- 14847 Shottery Dr
- 1343 Littleport Ln
- 1502 Stevenage Ln
- 1323 Padstow Ln
- 15822 Mesenbrink Ln
- 14808 Welbeck Dr
- 15215 Peachmeadow Ln
- 15223 Bedford Glen Dr
- 14918 Silver Green Dr S
- 14951 Scotter Dr
- 14807 Shottery Dr
- 1610 Evesham Dr
- 1303 Sterling Green Ct
- 1915 Aldates Dr
- 909 Pennygent Ln
- 1330 Stevenage Ln
- 1714 Laura Anne Dr
- 15911 Breanna Ln
- 15010 Peachmeadow Ln
- 15002 Peachmeadow Ln
- 15007 Roseglen Cir
- 15003 Roseglen Cir
- 15014 Peachmeadow Ln
- 15007 Peachmeadow Ln
- 15011 Roseglen Cir
- 15011 Peachmeadow Ln
- 15018 Peachmeadow Ln
- 1542 Carbonear Dr
- 1538 Carbonear Dr
- 15015 Peachmeadow Ln
- 1546 Carbonear Dr
- 1534 Carbonear Dr
- 15015 Roseglen Cir
- 1554 Carbonear Dr
- 1526 Carbonear Dr
- 15019 Peachmeadow Ln
- 1522 Carbonear Dr
- 1511 Pennygent Ln