Estimated Value: $276,000 - $323,000
4
Beds
2
Baths
2,178
Sq Ft
$138/Sq Ft
Est. Value
About This Home
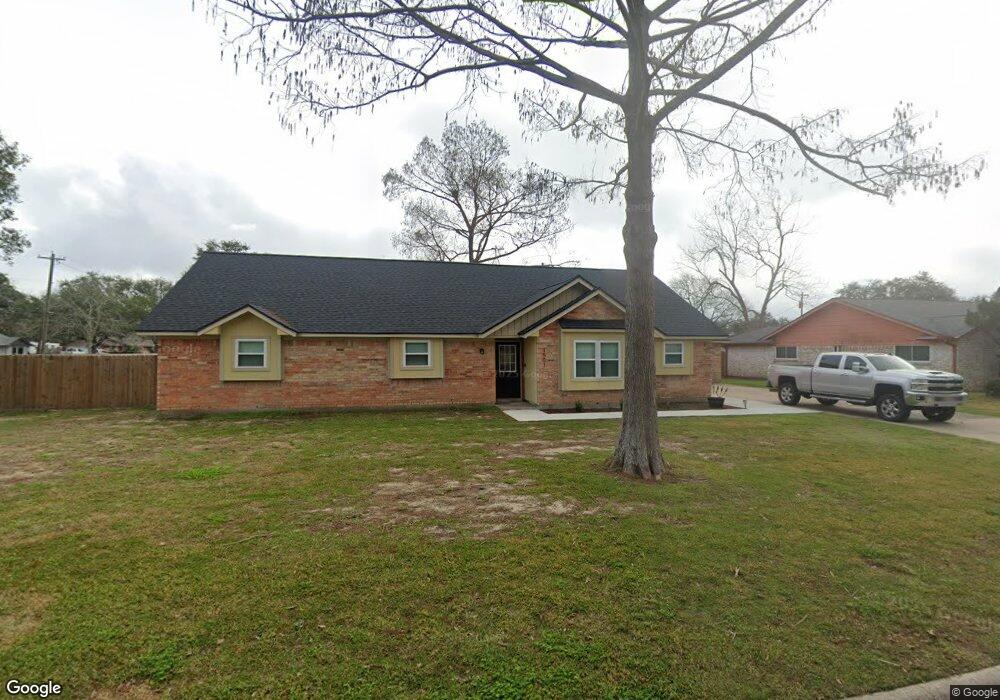
This home is located at 1501 Crown Dr, Alvin, TX 77511 and is currently estimated at $299,690, approximately $137 per square foot. 1501 Crown Dr is a home located in Brazoria County with nearby schools including Alvin Elementary School, Alvin Junior High School, and Alvin High School.
Ownership History
Date
Name
Owned For
Owner Type
Purchase Details
Closed on
Mar 13, 2025
Sold by
Flores Emily
Bought by
Wilke Tyler James
Current Estimated Value
Home Financials for this Owner
Home Financials are based on the most recent Mortgage that was taken out on this home.
Original Mortgage
$207,200
Outstanding Balance
$205,978
Interest Rate
6.95%
Mortgage Type
New Conventional
Estimated Equity
$93,712
Purchase Details
Closed on
Aug 25, 2015
Sold by
The Bank Of New York Mellon
Bought by
Miller Jerry
Purchase Details
Closed on
Apr 7, 2015
Sold by
Avila Rafael R and Avila Llene
Bought by
The Bank Of New York Mellon
Purchase Details
Closed on
Jan 24, 2004
Sold by
Peterson Ronald J
Bought by
Avila Rafael R and Avila Ilene
Home Financials for this Owner
Home Financials are based on the most recent Mortgage that was taken out on this home.
Original Mortgage
$133,929
Interest Rate
5.78%
Mortgage Type
Purchase Money Mortgage
Create a Home Valuation Report for This Property
The Home Valuation Report is an in-depth analysis detailing your home's value as well as a comparison with similar homes in the area
Home Values in the Area
Average Home Value in this Area
Purchase History
| Date | Buyer | Sale Price | Title Company |
|---|---|---|---|
| Wilke Tyler James | -- | South Land Title | |
| Miller Jerry | -- | None Available | |
| The Bank Of New York Mellon | $144,808 | None Available | |
| Avila Rafael R | -- | Alamo Title 4 |
Source: Public Records
Mortgage History
| Date | Status | Borrower | Loan Amount |
|---|---|---|---|
| Open | Wilke Tyler James | $207,200 | |
| Previous Owner | Avila Rafael R | $133,929 |
Source: Public Records
Tax History Compared to Growth
Tax History
| Year | Tax Paid | Tax Assessment Tax Assessment Total Assessment is a certain percentage of the fair market value that is determined by local assessors to be the total taxable value of land and additions on the property. | Land | Improvement |
|---|---|---|---|---|
| 2025 | $4,637 | $262,870 | $30,300 | $232,570 |
| 2023 | $4,637 | $273,800 | $32,630 | $241,170 |
| 2022 | $6,208 | $226,340 | $32,630 | $193,710 |
| 2021 | $5,834 | $202,090 | $36,360 | $165,730 |
| 2020 | $5,455 | $186,370 | $30,770 | $155,600 |
| 2019 | $5,149 | $171,420 | $23,310 | $148,110 |
| 2018 | $5,029 | $167,140 | $23,310 | $143,830 |
| 2017 | $4,912 | $161,200 | $23,310 | $137,890 |
| 2016 | $4,973 | $163,210 | $23,310 | $139,900 |
| 2014 | -- | $138,600 | $23,310 | $115,290 |
Source: Public Records
Map
Nearby Homes
- 2514 Westfield St
- 2714 Westfield St
- 2016 W Davis Bend St
- 000 Corner of County Road 180 and County Road 181 Rd
- 2604 Adams St
- 00 Davis Bend County Rd 179 Rd
- 2609 Adams St
- 1916 Tracy Lynn Ln
- 1902 Westview Dr
- 2306 Westfield St
- 2693 Fairview Dr
- 3206 Deer Trail Dr
- 2609 Quail Run Dr
- 0 Kost Rd
- 1655 Kost Rd
- 2408 Chelmsford Ct
- 3293 County Road 181
- 1600 Rosharon Rd Unit 19
- 1109 Hampton Cir
- 256 Davis Bend Rd