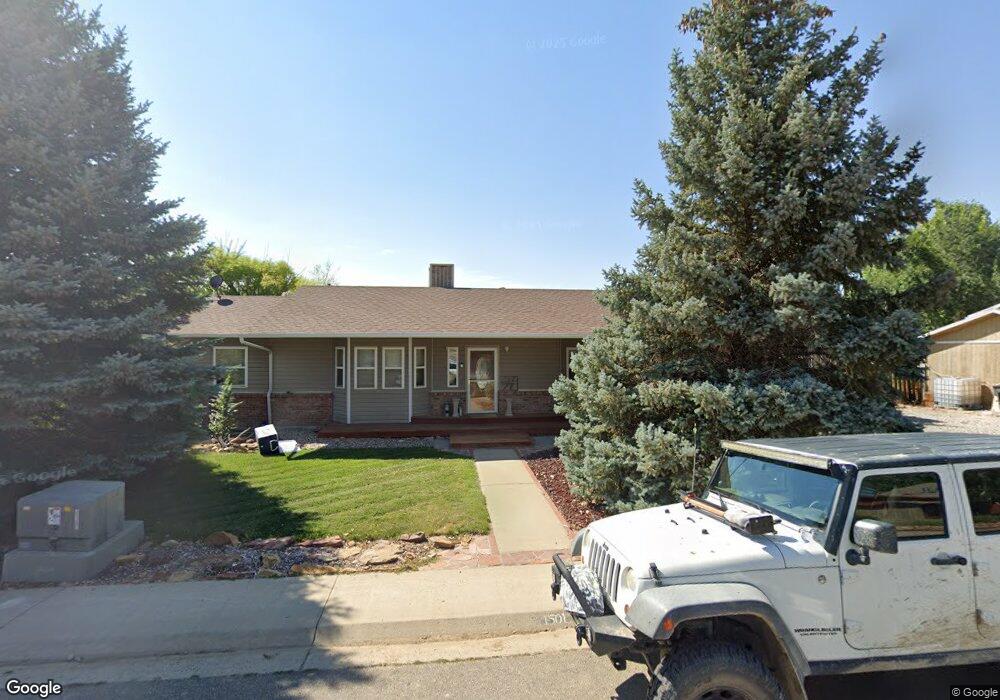
1501 La Mesa Cir Rangely, CO 81648
Estimated Value: $280,884 - $360,000
3
Beds
2
Baths
2,422
Sq Ft
$132/Sq Ft
Est. Value
About This Home
This home is located at 1501 La Mesa Cir, Rangely, CO 81648 and is currently estimated at $319,471, approximately $131 per square foot. 1501 La Mesa Cir is a home located in Rio Blanco County with nearby schools including Parkview Elementary School, Rangely Junior/Senior High School, and Rangely Christian Academy.
Ownership History
Date
Name
Owned For
Owner Type
Purchase Details
Closed on
Mar 27, 2008
Sold by
Polley Nathaniel C and Polley Chelsea J
Bought by
Williams Mark and Williams Sara
Current Estimated Value
Home Financials for this Owner
Home Financials are based on the most recent Mortgage that was taken out on this home.
Original Mortgage
$194,750
Outstanding Balance
$121,748
Interest Rate
5.72%
Mortgage Type
FHA
Estimated Equity
$197,723
Purchase Details
Closed on
Sep 28, 2007
Sold by
Baughman George W and Baughman Rohnda G
Bought by
Polley Nathaniel C and Polley Chelsea J
Home Financials for this Owner
Home Financials are based on the most recent Mortgage that was taken out on this home.
Original Mortgage
$180,000
Interest Rate
6.66%
Mortgage Type
New Conventional
Create a Home Valuation Report for This Property
The Home Valuation Report is an in-depth analysis detailing your home's value as well as a comparison with similar homes in the area
Home Values in the Area
Average Home Value in this Area
Purchase History
| Date | Buyer | Sale Price | Title Company |
|---|---|---|---|
| Williams Mark | $197,500 | None Available | |
| Polley Nathaniel C | $180,000 | None Available |
Source: Public Records
Mortgage History
| Date | Status | Borrower | Loan Amount |
|---|---|---|---|
| Open | Williams Mark | $194,750 | |
| Previous Owner | Polley Nathaniel C | $180,000 |
Source: Public Records
Tax History Compared to Growth
Tax History
| Year | Tax Paid | Tax Assessment Tax Assessment Total Assessment is a certain percentage of the fair market value that is determined by local assessors to be the total taxable value of land and additions on the property. | Land | Improvement |
|---|---|---|---|---|
| 2024 | $994 | $11,840 | $1,660 | $10,180 |
| 2023 | $994 | $11,840 | $1,660 | $10,180 |
| 2022 | $1,017 | $13,930 | $2,190 | $11,740 |
| 2021 | $1,021 | $13,930 | $2,190 | $11,740 |
| 2020 | $999 | $14,000 | $2,150 | $11,850 |
| 2019 | $939 | $14,000 | $2,150 | $11,850 |
| 2018 | $919 | $14,680 | $2,050 | $12,630 |
| 2017 | $1,025 | $14,680 | $2,050 | $12,630 |
| 2016 | $1,130 | $16,860 | $2,270 | $14,590 |
| 2015 | $898 | $16,860 | $0 | $0 |
| 2014 | $898 | $16,240 | $0 | $0 |
| 2013 | $953 | $16,980 | $0 | $0 |
| 2012 | $953 | $17,190 | $2,870 | $14,320 |
Source: Public Records
Map
Nearby Homes
- 1260 Deserado Dr
- 1351 La Mesa Cir
- 298 Darius Ave
- 298 Middle St
- 243 Crest St
- 236 S Birch Ave
- 115 S Jones Ave
- 302 W Main St
- 203 Dakota Ave
- 1818 County Road 46
- 500 Rider Rd
- 1041 Tanglewood Ln
- 399 River Rd
- 417 Rio Mesa Dr
- 415 Rio Mesa Dr
- 416 Rio Mesa Dr
- 414 Rio Mesa Dr
- 404 Rio Mesa Dr
- 406 Rio Mesa Dr
- 0 Tbd Highway 40
- 1497 La Mesa Cir
- 1511 La Mesa Cir
- 1502 La Mesa Cir
- 1495 La Mesa Cir
- 1512 La Mesa Cir
- 1523 La Mesa Cir
- 1485 La Mesa Cir
- 1524 La Mesa Cir
- 1207 Sunridge Ave
- 1529 La Mesa Cir
- 1474 La Mesa Cir
- 1210 Deserado Dr
- 1210 Deserado Dr Unit Yuma Model
- 1217 Sunridge Ave
- 1473 La Mesa Cir
- 1234 Solar Cir
- 1536 La Mesa Cir
- 1535 La Mesa Cir
- 1275 La Mesa Cir
- 1460 La Mesa Cir