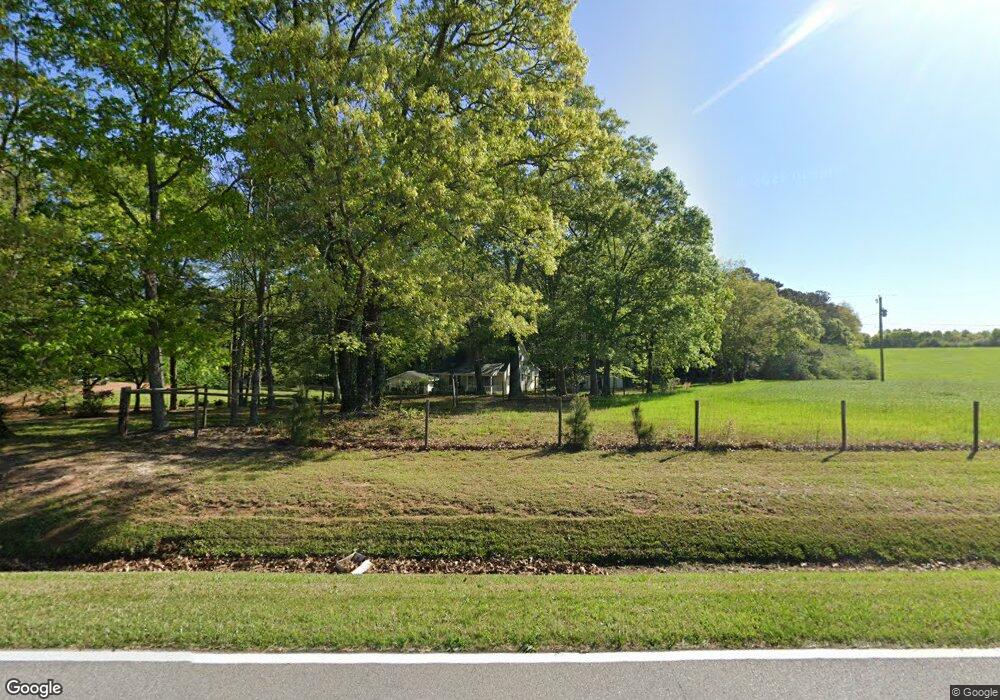
1501 Miller Academy Rd Carrollton, GA 30117
Abilene NeighborhoodEstimated Value: $285,000 - $299,272
3
Beds
3
Baths
1,600
Sq Ft
$181/Sq Ft
Est. Value
About This Home
This home is located at 1501 Miller Academy Rd, Carrollton, GA 30117 and is currently estimated at $290,318, approximately $181 per square foot. 1501 Miller Academy Rd is a home located in Carroll County with nearby schools including Mt. Zion Elementary School, Mt. Zion Middle School, and Mt. Zion High School.
Ownership History
Date
Name
Owned For
Owner Type
Purchase Details
Closed on
Nov 6, 2024
Sold by
Pope Sherri
Bought by
Pope Sherri
Current Estimated Value
Purchase Details
Closed on
Jul 9, 2019
Sold by
Muse Charlotte C
Bought by
Pope Sherri
Home Financials for this Owner
Home Financials are based on the most recent Mortgage that was taken out on this home.
Original Mortgage
$140,409
Interest Rate
3.99%
Mortgage Type
FHA
Purchase Details
Closed on
Apr 2, 2014
Sold by
Muse John S and Muse Charlotte C
Bought by
Muse Charlotte C
Purchase Details
Closed on
Mar 4, 2003
Sold by
Muse John S
Bought by
Muse John S and Muse Charlotte C
Purchase Details
Closed on
Feb 23, 2001
Sold by
Muse John S and Muse Charlo
Bought by
Muse John S
Purchase Details
Closed on
Aug 1, 1996
Bought by
Muse John S and Muse Charlo
Create a Home Valuation Report for This Property
The Home Valuation Report is an in-depth analysis detailing your home's value as well as a comparison with similar homes in the area
Home Values in the Area
Average Home Value in this Area
Purchase History
| Date | Buyer | Sale Price | Title Company |
|---|---|---|---|
| Pope Sherri | -- | -- | |
| Pope Sherri | $143,000 | -- | |
| Muse Charlotte C | -- | -- | |
| Muse John S | -- | -- | |
| Muse John S | -- | -- | |
| Muse John S | -- | -- |
Source: Public Records
Mortgage History
| Date | Status | Borrower | Loan Amount |
|---|---|---|---|
| Previous Owner | Pope Sherri | $140,409 |
Source: Public Records
Tax History Compared to Growth
Tax History
| Year | Tax Paid | Tax Assessment Tax Assessment Total Assessment is a certain percentage of the fair market value that is determined by local assessors to be the total taxable value of land and additions on the property. | Land | Improvement |
|---|---|---|---|---|
| 2024 | $2,178 | $96,286 | $16,102 | $80,184 |
| 2023 | $2,178 | $86,660 | $12,882 | $73,778 |
| 2022 | $1,702 | $67,850 | $8,588 | $59,262 |
| 2021 | $1,505 | $58,708 | $6,870 | $51,838 |
| 2020 | $1,331 | $51,842 | $6,246 | $45,596 |
| 2019 | $261 | $48,737 | $6,246 | $42,491 |
| 2018 | $274 | $41,545 | $3,343 | $38,202 |
| 2017 | $276 | $41,545 | $3,343 | $38,202 |
| 2016 | $277 | $41,545 | $3,343 | $38,202 |
| 2015 | $279 | $41,130 | $7,350 | $33,781 |
| 2014 | $281 | $41,131 | $7,350 | $33,781 |
Source: Public Records
Map
Nearby Homes
- 177 Garnett Point Dr
- 1800 Mandeville Rd
- 0000 Hog Liver Rd
- Plan 1709 at Saddle Ridge
- Plan 3119 at Saddle Ridge
- Plan 1902 at Saddle Ridge
- Plan 2131 at Saddle Ridge
- Plan 2307 at Saddle Ridge
- Plan 2604 at Saddle Ridge
- 00 Hog Liver Rd Unit 346
- 0 Hog Liver Rd Unit 148331
- 0 Hog Liver Rd Unit 10630257
- 0 Hog Liver Rd Unit 7671087
- 0 Hog Liver Rd Unit 10614601
- 0 Hog Liver Rd Unit 10630818
- 406 Holly Springs Rd
- 2519 Hog Liver Rd
- 676 Hog Liver Rd
- 539 Saddle Chase Dr
- 0 Hwy 27 N
- 1525 Miller Academy Rd
- 1112 Bell Rd
- 1420 Miller Academy Rd
- 1536 Miller Academy Rd
- 1591 Miller Academy Rd
- 1405 Miller Academy Rd
- 1630 Miller Academy Rd
- 0 J C Daniell Unit TRACT C
- 0 J C Daniell Tract C Rd Unit 10246509
- 1235 Mandeville Rd
- 1245 Mandeville Rd
- 1255 Mandeville Rd
- 1225 Mandeville Rd
- 1277 Mandeville Rd
- 209 Cranston Ct
- 1107 Bell Rd
- 1320 Miller Academy Rd
- 1315 Miller Academy Rd
- 200 Cranston Ct
- 0 Goolsby Rd