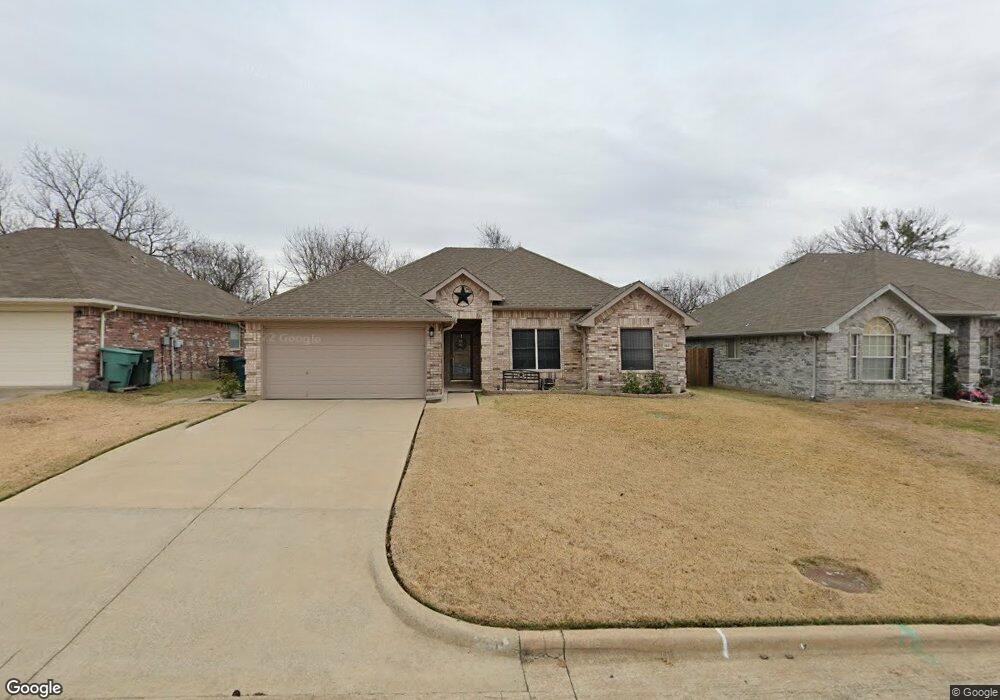
1501 Southridge Ln Sherman, TX 75092
Estimated Value: $278,000 - $284,000
4
Beds
2
Baths
1,750
Sq Ft
$161/Sq Ft
Est. Value
About This Home
This home is located at 1501 Southridge Ln, Sherman, TX 75092 and is currently estimated at $281,004, approximately $160 per square foot. 1501 Southridge Ln is a home located in Grayson County with nearby schools including Henry W. Sory Elementary School, Piner Middle School, and Dillingham Intermediate School.
Ownership History
Date
Name
Owned For
Owner Type
Purchase Details
Closed on
Apr 15, 2025
Sold by
Ragan Lawrence William
Bought by
Ragan Lawrence William and Mckinney Laurel Ann
Current Estimated Value
Purchase Details
Closed on
Sep 28, 2015
Sold by
Alkhatib Youseff and Alkhatib Hreann
Bought by
Baker William Donald and Baker Linda Marie
Home Financials for this Owner
Home Financials are based on the most recent Mortgage that was taken out on this home.
Original Mortgage
$119,000
Interest Rate
3.99%
Mortgage Type
New Conventional
Purchase Details
Closed on
May 15, 2013
Sold by
Patton Thomas Garrett and Patton Janetta S
Bought by
Alkhatib Youseff
Home Financials for this Owner
Home Financials are based on the most recent Mortgage that was taken out on this home.
Original Mortgage
$106,000
Interest Rate
3.56%
Mortgage Type
New Conventional
Create a Home Valuation Report for This Property
The Home Valuation Report is an in-depth analysis detailing your home's value as well as a comparison with similar homes in the area
Home Values in the Area
Average Home Value in this Area
Purchase History
| Date | Buyer | Sale Price | Title Company |
|---|---|---|---|
| Ragan Lawrence William | -- | None Listed On Document | |
| Baker William Donald | -- | None Available | |
| Alkhatib Youseff | -- | None Available |
Source: Public Records
Mortgage History
| Date | Status | Borrower | Loan Amount |
|---|---|---|---|
| Previous Owner | Baker William Donald | $119,000 | |
| Previous Owner | Alkhatib Youseff | $106,000 |
Source: Public Records
Tax History Compared to Growth
Tax History
| Year | Tax Paid | Tax Assessment Tax Assessment Total Assessment is a certain percentage of the fair market value that is determined by local assessors to be the total taxable value of land and additions on the property. | Land | Improvement |
|---|---|---|---|---|
| 2025 | $2,071 | $253,226 | $48,859 | $204,367 |
| 2024 | $6,130 | $279,510 | $0 | $0 |
| 2023 | $2,075 | $254,100 | $0 | $0 |
| 2022 | $5,414 | $231,000 | $0 | $0 |
| 2021 | $5,264 | $210,000 | $38,280 | $171,720 |
| 2020 | $5,315 | $202,676 | $26,030 | $176,646 |
| 2019 | $4,962 | $184,089 | $12,480 | $171,609 |
| 2018 | $4,338 | $172,891 | $12,480 | $160,411 |
| 2017 | $3,701 | $163,226 | $12,480 | $150,746 |
| 2016 | $3,364 | $155,023 | $12,480 | $142,543 |
| 2015 | $2,572 | $122,857 | $12,480 | $110,377 |
| 2014 | $2,654 | $120,291 | $12,480 | $107,811 |
Source: Public Records
Map
Nearby Homes
- 1600 Creekside Ave
- 1612 Citrus Dr
- 1104 Southridge Ln
- 1712 Timberline Ln
- 2939 Peony Dr
- 1803 Boxwood Dr
- 2821 Jasmine Dr
- 1819 Boxwood Dr
- 1901 Timberline Ln
- 2805 Clover Dr
- 1020 Silverton Dr
- 1905 Southridge Ln
- 2908 Rosemary Dr
- 1913 Timberline Ln
- 2507 Hollyhill Way
- 2412 Hollyhill Way
- 2408 Hollyhill Way
- 2209 Ridgecrest Ln
- 2511 Hollyhill Way
- 2502 Hollyhill Way
- 1421 Southridge Ln
- 1505 Southridge Ln
- 1509 Southridge Ln
- 1417 Southridge Ln
- 1500 Southridge Ln
- 1500 Creekside Ave
- 1513 Southridge Ln
- 1403 Southridge Ln
- 1504 Southridge Ln
- 1504 Creekside Ave
- 1305 Southridge Ln
- 3200 Brookstone Dr
- 1505 Creekside Ave
- 1521 Southridge Ln
- 1508 Southridge Ln
- 3204 Brookstone Dr
- 1508 Creekside Ave
- 1301 Southridge Ln
- 1509 Creekside Ave
- 3208 Brookstone Dr