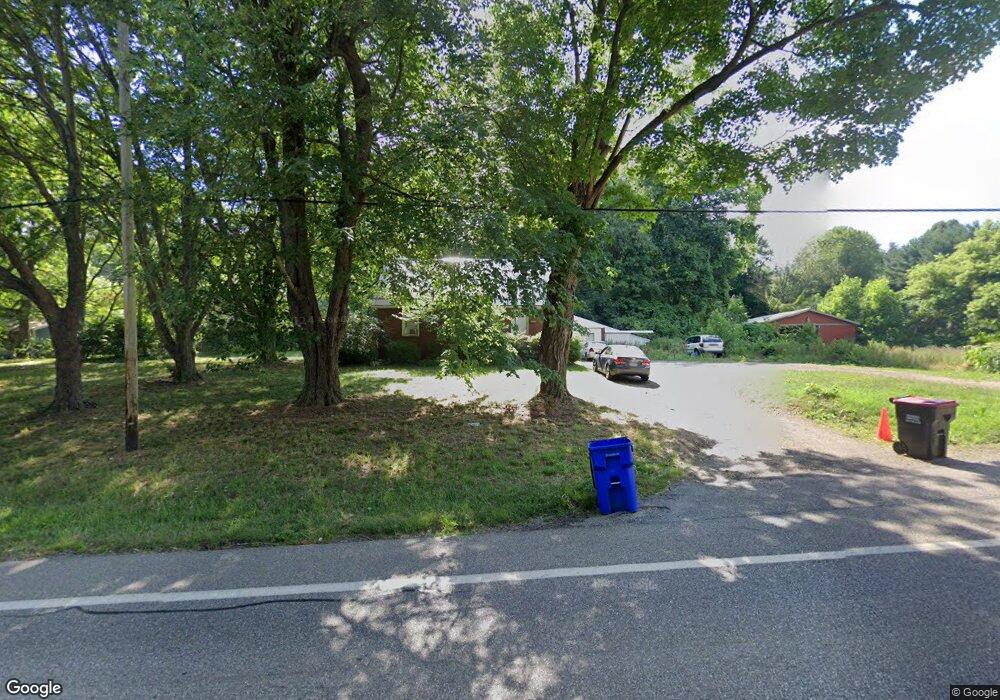
1501 State Route 43 Mogadore, OH 44260
Estimated Value: $176,000 - $211,000
4
Beds
1
Bath
1,155
Sq Ft
$165/Sq Ft
Est. Value
About This Home
This home is located at 1501 State Route 43, Mogadore, OH 44260 and is currently estimated at $191,108, approximately $165 per square foot. 1501 State Route 43 is a home located in Portage County with nearby schools including Suffield Elementary School, Field Middle School, and Field High School.
Ownership History
Date
Name
Owned For
Owner Type
Purchase Details
Closed on
Mar 18, 2009
Sold by
Kisamore Kevin and Kisamore Mason M
Bought by
Kisamore Mason M and Kisamore Stacy E
Current Estimated Value
Home Financials for this Owner
Home Financials are based on the most recent Mortgage that was taken out on this home.
Original Mortgage
$81,295
Outstanding Balance
$20,907
Interest Rate
5.2%
Mortgage Type
New Conventional
Estimated Equity
$170,201
Purchase Details
Closed on
Jul 1, 2004
Sold by
Kisamore David
Bought by
Kisamore Mason M and Kisamore Kevin
Home Financials for this Owner
Home Financials are based on the most recent Mortgage that was taken out on this home.
Original Mortgage
$72,000
Interest Rate
5.75%
Mortgage Type
Purchase Money Mortgage
Purchase Details
Closed on
Jan 1, 1990
Bought by
Kisamore Owen
Create a Home Valuation Report for This Property
The Home Valuation Report is an in-depth analysis detailing your home's value as well as a comparison with similar homes in the area
Home Values in the Area
Average Home Value in this Area
Purchase History
| Date | Buyer | Sale Price | Title Company |
|---|---|---|---|
| Kisamore Mason M | -- | None Available | |
| Kisamore Mason M | $82,000 | Chicago Title Insurance Comp | |
| Kisamore Owen | -- | -- |
Source: Public Records
Mortgage History
| Date | Status | Borrower | Loan Amount |
|---|---|---|---|
| Open | Kisamore Mason M | $81,295 | |
| Closed | Kisamore Mason M | $72,000 |
Source: Public Records
Tax History Compared to Growth
Tax History
| Year | Tax Paid | Tax Assessment Tax Assessment Total Assessment is a certain percentage of the fair market value that is determined by local assessors to be the total taxable value of land and additions on the property. | Land | Improvement |
|---|---|---|---|---|
| 2024 | $2,244 | $54,570 | $11,550 | $43,020 |
| 2023 | $1,891 | $37,320 | $8,930 | $28,390 |
| 2022 | $1,890 | $37,320 | $8,930 | $28,390 |
| 2021 | $1,875 | $37,320 | $8,930 | $28,390 |
| 2020 | $1,788 | $32,380 | $8,930 | $23,450 |
| 2019 | $1,793 | $32,380 | $8,930 | $23,450 |
| 2018 | $1,400 | $30,980 | $9,800 | $21,180 |
| 2017 | $1,400 | $30,980 | $9,800 | $21,180 |
| 2016 | $1,384 | $30,980 | $9,800 | $21,180 |
| 2015 | $1,385 | $30,980 | $9,800 | $21,180 |
| 2014 | $1,347 | $30,980 | $9,800 | $21,180 |
| 2013 | $1,336 | $30,980 | $9,800 | $21,180 |
Source: Public Records
Map
Nearby Homes
- 1195 Etter Rd
- 1369 S Polen Ave
- S/L 38 1150 Lakeview Dr
- S/L 11 959 Sunrise Dr
- S/L 37 1140 Lakeview Dr
- 0 Randolph Rd Unit 5112744
- VL 863 State Route 43
- 1811 Randolph Rd
- 1660 Martin Rd
- 0 Martin Rd Unit 5159388
- 613 Mishler Rd
- 502 Valley Crest Dr
- 596 Ticknor Rd
- 3985 Etter Rd
- 268 Randolph Rd
- 377 S Cleveland Ave
- 112 Sunrise Blvd E
- 1272 Portage Line Rd
- 3874 Prospect St
- 1379 Wood Fern Dr
- 1485 State Route 43
- 1537 State Route 43
- 1473 State Route 43
- 1496 State Route 43
- 1221 Etter Rd
- 1231 Etter Rd
- 1211 Etter Rd
- 1421 State Route 43
- 1206 Etter Rd
- 1171 Etter Rd
- 1194 Etter Rd
- 1176 Etter Rd
- 1181 Etter Rd
- 1400 State Route 43
- 1168 Etter Rd
- 1623 State Route 43
- 1386 State Route 43
- 1383 State Route 43
- 1158 Etter Rd
- 1077 Etter Rd