Estimated Value: $273,000 - $316,000
3
Beds
2
Baths
1,568
Sq Ft
$188/Sq Ft
Est. Value
About This Home
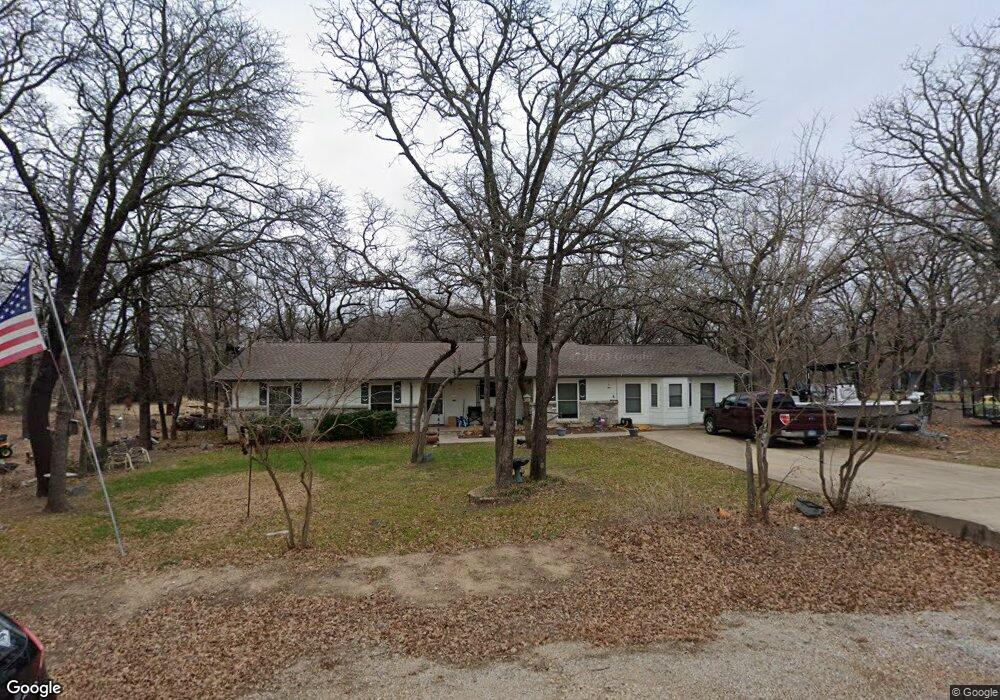
This home is located at 1501 Tanglewood Dr, Azle, TX 76020 and is currently estimated at $294,941, approximately $188 per square foot. 1501 Tanglewood Dr is a home located in Parker County with nearby schools including Cross Timbers Elementary School, W E Hoover Elementary School, and Santo Forte Junior High School.
Ownership History
Date
Name
Owned For
Owner Type
Purchase Details
Closed on
Nov 20, 2012
Sold by
Pina Jose A
Bought by
Massingili Shawna J
Current Estimated Value
Home Financials for this Owner
Home Financials are based on the most recent Mortgage that was taken out on this home.
Original Mortgage
$116,745
Outstanding Balance
$80,826
Interest Rate
3.43%
Mortgage Type
FHA
Estimated Equity
$214,115
Purchase Details
Closed on
Dec 2, 2008
Sold by
Benfer Raymond O and Benfer Barbara
Bought by
Massingill Shawna J
Home Financials for this Owner
Home Financials are based on the most recent Mortgage that was taken out on this home.
Original Mortgage
$60,000
Interest Rate
6.48%
Mortgage Type
VA
Purchase Details
Closed on
Aug 31, 1999
Sold by
Flynn O S
Bought by
Massingill Shawna J
Create a Home Valuation Report for This Property
The Home Valuation Report is an in-depth analysis detailing your home's value as well as a comparison with similar homes in the area
Home Values in the Area
Average Home Value in this Area
Purchase History
| Date | Buyer | Sale Price | Title Company |
|---|---|---|---|
| Massingili Shawna J | -- | Stc | |
| Massingill Shawna J | -- | -- | |
| Pina Jose A | -- | None Available | |
| Massingill Shawna J | -- | -- |
Source: Public Records
Mortgage History
| Date | Status | Borrower | Loan Amount |
|---|---|---|---|
| Open | Massingili Shawna J | $116,745 | |
| Previous Owner | Pina Jose A | $60,000 |
Source: Public Records
Tax History Compared to Growth
Tax History
| Year | Tax Paid | Tax Assessment Tax Assessment Total Assessment is a certain percentage of the fair market value that is determined by local assessors to be the total taxable value of land and additions on the property. | Land | Improvement |
|---|---|---|---|---|
| 2025 | $1,206 | $223,318 | -- | -- |
| 2024 | $1,206 | $203,016 | -- | -- |
| 2023 | $1,206 | $184,560 | $0 | $0 |
| 2022 | $3,105 | $185,840 | $36,000 | $149,840 |
| 2021 | $2,957 | $185,840 | $36,000 | $149,840 |
| 2020 | $2,674 | $144,520 | $20,000 | $124,520 |
| 2019 | $2,576 | $144,520 | $20,000 | $124,520 |
| 2018 | $2,350 | $114,600 | $8,000 | $106,600 |
| 2017 | $2,138 | $114,600 | $8,000 | $106,600 |
| 2016 | $1,944 | $99,500 | $8,000 | $91,500 |
| 2015 | $715 | $99,500 | $8,000 | $91,500 |
| 2014 | $1,833 | $103,520 | $8,000 | $95,520 |
Source: Public Records
Map
Nearby Homes
- 1517 Willow Wood Dr
- 308 Ashwood St
- 1600 Willow Wood Dr
- 405 Ashwood St
- 214 Pearson Ln
- 849 Jackson Trail
- 125 Live Oak St
- 8009 Encanto Way
- 8001 Encanto Way
- 8000 Encanto Way
- 8017 Alegre Ct
- 8009 Alegre Ct
- 8049 Encanto Way
- 8025 Encanto Way
- 8066 Encanto Way
- 8008 Encanto Way
- 8016 Encanto Way
- 8001 Alegre Ct
- 8000 Alegre Ct
- 8041 Encanto Way
- 1508 Tanglewood Dr
- 304 Cedarwood St
- 1517 Tanglewood Dr
- 1516 Tanglewood Dr
- 305 Cedarwood St
- 1520 Tanglewood Dr
- 309 Cedarwood St
- 1525 Tanglewood Dr
- 312 Cedarwood St
- 304 Hickorywood St
- 1601 Tanglewood Dr
- 308 Hickorywood St
- 317 Cedarwood St
- 312 Hickorywood St
- 320 Cedarwood St
- 1604 Tanglewood Dr
- 316 Hickorywood St
- 321 Cedarwood St
- 309 Hickorywood St
- 1608 Tanglewood Dr