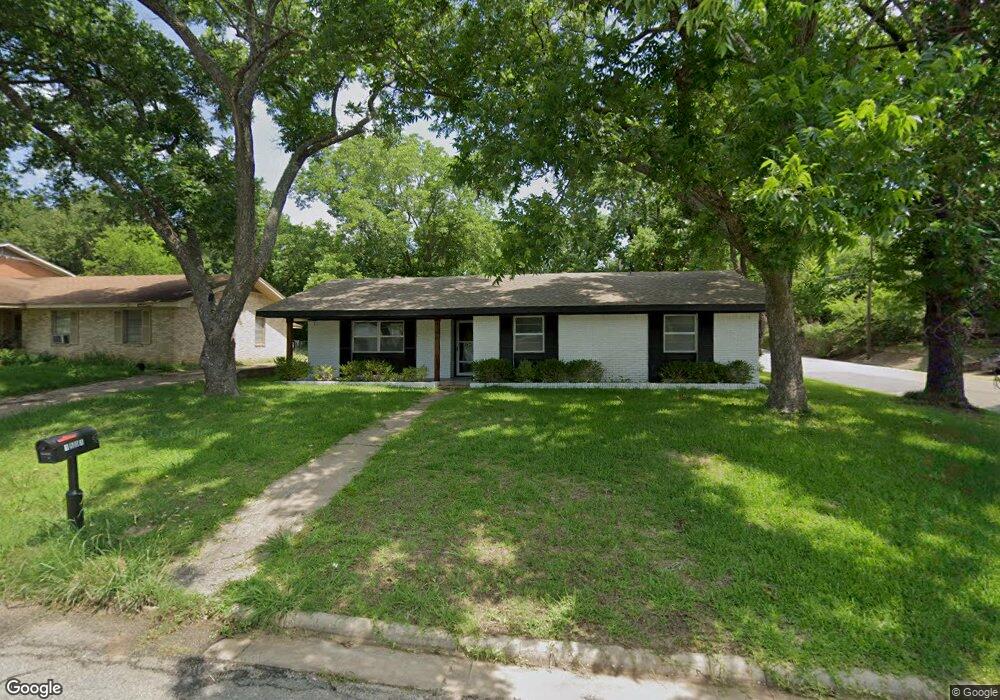
1501 W Chestnut St Denison, TX 75020
Estimated Value: $227,000 - $240,971
4
Beds
2
Baths
2,350
Sq Ft
$100/Sq Ft
Est. Value
About This Home
This home is located at 1501 W Chestnut St, Denison, TX 75020 and is currently estimated at $233,986, approximately $99 per square foot. 1501 W Chestnut St is a home located in Grayson County with nearby schools including Houston Elementary School, Scott Middle School, and Denison High School.
Ownership History
Date
Name
Owned For
Owner Type
Purchase Details
Closed on
Jan 28, 2022
Sold by
Teresa Cleveland
Bought by
Sam Estates Llc
Current Estimated Value
Home Financials for this Owner
Home Financials are based on the most recent Mortgage that was taken out on this home.
Original Mortgage
$179,400
Interest Rate
3.22%
Mortgage Type
Construction
Purchase Details
Closed on
Aug 6, 2020
Sold by
Cleveland Faye Ellen
Bought by
Cleveland Teresa and Chandler Karen
Purchase Details
Closed on
Aug 26, 2016
Sold by
Oden Patsy L
Bought by
Cleveland Faye E and Cleveland Wilbur L
Purchase Details
Closed on
Apr 25, 2005
Sold by
Holt Bill W and Holt Sandra
Bought by
Oden Glen E and Oden Patsy L
Purchase Details
Closed on
Aug 13, 2004
Sold by
Boren Barbara
Bought by
Holt Bill W
Home Financials for this Owner
Home Financials are based on the most recent Mortgage that was taken out on this home.
Original Mortgage
$69,500
Interest Rate
6.18%
Mortgage Type
Purchase Money Mortgage
Create a Home Valuation Report for This Property
The Home Valuation Report is an in-depth analysis detailing your home's value as well as a comparison with similar homes in the area
Home Values in the Area
Average Home Value in this Area
Purchase History
| Date | Buyer | Sale Price | Title Company |
|---|---|---|---|
| Sam Estates Llc | -- | Sendera Title | |
| Cleveland Teresa | -- | None Available | |
| Cleveland Faye E | -- | Grayson County Title | |
| Oden Glen E | -- | Grayson County Title Company | |
| Holt Bill W | -- | -- |
Source: Public Records
Mortgage History
| Date | Status | Borrower | Loan Amount |
|---|---|---|---|
| Closed | Sam Estates Llc | $179,400 | |
| Previous Owner | Holt Bill W | $69,500 |
Source: Public Records
Tax History Compared to Growth
Tax History
| Year | Tax Paid | Tax Assessment Tax Assessment Total Assessment is a certain percentage of the fair market value that is determined by local assessors to be the total taxable value of land and additions on the property. | Land | Improvement |
|---|---|---|---|---|
| 2025 | $5,230 | $221,653 | $44,652 | $177,001 |
| 2024 | $5,230 | $225,089 | $48,360 | $176,729 |
| 2023 | $5,022 | $221,648 | $42,557 | $179,091 |
| 2022 | $5,160 | $217,171 | $42,557 | $174,614 |
| 2021 | $4,096 | $163,541 | $23,052 | $140,489 |
| 2020 | $3,895 | $147,645 | $15,556 | $132,089 |
| 2019 | $4,065 | $150,568 | $12,977 | $137,591 |
| 2018 | $3,725 | $137,476 | $8,382 | $129,094 |
| 2017 | $3,415 | $122,080 | $7,415 | $114,665 |
| 2016 | $1,769 | $113,260 | $4,352 | $108,908 |
| 2015 | $1,433 | $105,629 | $5,561 | $100,068 |
| 2014 | $1,580 | $104,853 | $5,561 | $99,292 |
Source: Public Records
Map
Nearby Homes
- 1531 W Main St
- 1326 W Crawford St
- 1609 W Woodard St
- 1319 W Morgan St
- 1221 W Crawford St
- 1231 W Main St
- 108 N Eddy Ave
- 1731 W Crawford St
- 1230 W Woodard St
- 1223 W Owing St
- 501 S Eddy Ave
- 1315 W Gandy St
- 1217 W Nelson St
- 1120 W Owing St
- 1200 W Gandy St
- 1109 W Crawford St
- 1127 W Morgan St
- 1508 W Shepherd St
- 1224 W Nelson St
- 1208 W Sears St
- 1507 W Chestnut St
- 1511 W Chestnut St
- 1500 W Main St
- 1431 W Chestnut St
- 1506 W Main St
- 1510 W Main St
- 1515 W Chestnut St
- 1430 W Main St
- 1500 W Chestnut St
- 1423 W Chestnut St
- 1506 W Chestnut St
- 1514 W Main St
- 1510 W Chestnut St
- 1430 W Chestnut St
- 1422 W Main St
- 1520 W Main St
- 1516 W Chestnut St
- 1426 W Chestnut St
- 1420 W Chestnut St
- 120 S Fairbanks Ave