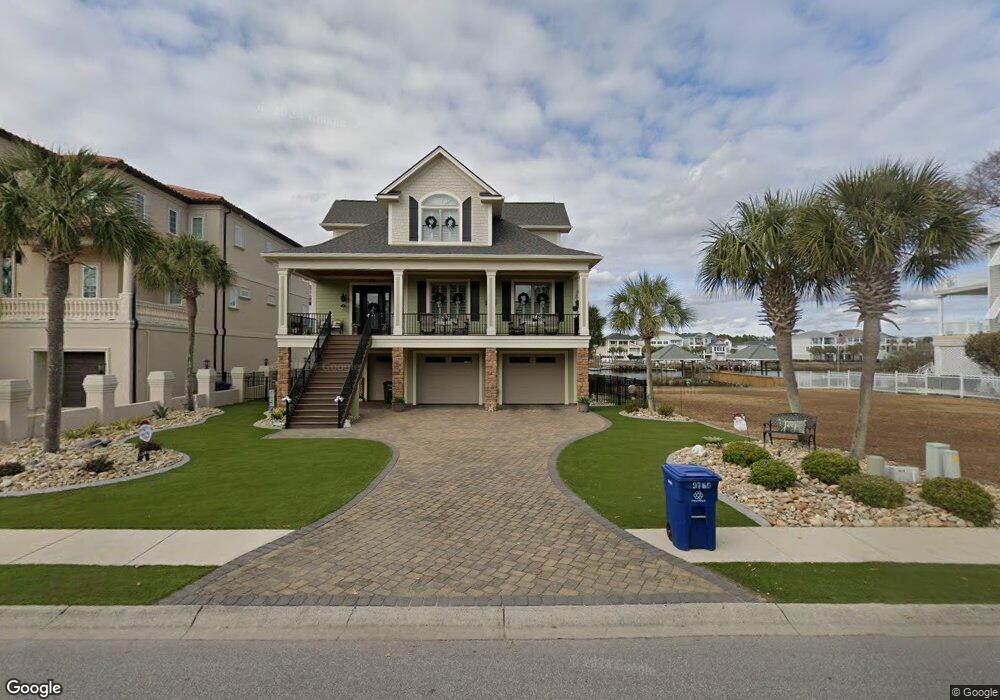
1501 Waterway Dr North Myrtle Beach, SC 29582
Ocean Drive NeighborhoodEstimated Value: $1,037,000 - $1,604,972
4
Beds
4
Baths
3,242
Sq Ft
$416/Sq Ft
Est. Value
About This Home
This home is located at 1501 Waterway Dr, North Myrtle Beach, SC 29582 and is currently estimated at $1,349,657, approximately $416 per square foot. 1501 Waterway Dr is a home with nearby schools including Ocean Drive Elementary School, North Myrtle Beach Middle School, and North Myrtle Beach High School.
Ownership History
Date
Name
Owned For
Owner Type
Purchase Details
Closed on
Dec 23, 2015
Sold by
Locklear Carol J
Bought by
Gentry William L and Gentry Kathy L
Current Estimated Value
Purchase Details
Closed on
Aug 1, 2011
Sold by
Mozeley Steven R
Bought by
Jones Carol C
Purchase Details
Closed on
Mar 19, 2010
Sold by
Master In Equity Horry County
Bought by
Mozeley Steve R
Purchase Details
Closed on
Nov 15, 2008
Sold by
Prisco Stephen
Bought by
Decastro Daniel A
Purchase Details
Closed on
Jun 9, 2006
Sold by
Matheny James M and Matheny Karen H
Bought by
Prisco Stephen and Klaus John R
Purchase Details
Closed on
Apr 23, 2004
Sold by
Daniel H Lewis Farms Inc
Bought by
Walters Leroyce Claybourn and Walters Peggy P
Purchase Details
Closed on
Apr 29, 2003
Sold by
Pennisi Domenick and Pennisi Maria M
Bought by
Daniel H Lewis Farms Inc
Purchase Details
Closed on
Jul 29, 1999
Sold by
Sunset Harbour Llc
Bought by
Pennisi Domenick and Pennisi Maria M
Create a Home Valuation Report for This Property
The Home Valuation Report is an in-depth analysis detailing your home's value as well as a comparison with similar homes in the area
Home Values in the Area
Average Home Value in this Area
Purchase History
| Date | Buyer | Sale Price | Title Company |
|---|---|---|---|
| Gentry William L | $297,500 | -- | |
| Jones Carol C | $320,000 | -- | |
| Mozeley Steve R | $201,000 | -- | |
| Decastro Daniel A | $111,508 | -- | |
| Prisco Stephen | $675,000 | None Available | |
| Walters Leroyce Claybourn | $320,000 | -- | |
| Daniel H Lewis Farms Inc | $245,000 | -- | |
| Pennisi Domenick | $171,500 | -- |
Source: Public Records
Tax History Compared to Growth
Tax History
| Year | Tax Paid | Tax Assessment Tax Assessment Total Assessment is a certain percentage of the fair market value that is determined by local assessors to be the total taxable value of land and additions on the property. | Land | Improvement |
|---|---|---|---|---|
| 2024 | $3,755 | $62,580 | $32,282 | $30,298 |
| 2023 | $3,755 | $32,225 | $10,541 | $21,684 |
| 2021 | $3,271 | $32,225 | $10,541 | $21,684 |
| 2020 | $3,195 | $32,225 | $10,541 | $21,684 |
| 2019 | $2,956 | $32,225 | $10,541 | $21,684 |
| 2018 | $0 | $30,974 | $10,298 | $20,676 |
| 2017 | $1,109 | $11,317 | $10,298 | $1,019 |
| 2016 | -- | $16,030 | $15,448 | $582 |
| 2015 | $3,156 | $14,043 | $14,043 | $0 |
| 2014 | $3,057 | $14,043 | $14,043 | $0 |
Source: Public Records
Map
Nearby Homes
- 4800 Williams Island Dr
- 1607 Waterway Dr
- 1608 Waterway Dr
- 1609 Eastover Ln
- 125 Serenity Point Dr
- 129 Serenity Point Dr
- 100 Serenity Point Dr
- 109 Serenity Point Dr
- 133 Serenity Point Dr
- 1619 Eastover Ln
- 4520 N Plantation Harbour Dr Unit F 9
- 4520 N Plantation Harbour Dr Unit F-21
- 4522 N Plantation Harbour Dr Unit E-3
- 4522 N Plantation Harbour Dr Unit E 7
- 4522 N Plantation Harbour Dr Unit E 13
- 4843 Williams Island Dr
- 4516 N Plantation Harbour Dr Unit H-3
- 4516 N Plantation Harbour Dr Unit H-12
- 4516 N Plantation Harbour Dr Unit H-1
- 1411 Cane St Unit 1
- 1413 Waterway Dr
- 1413 Waterway Dr Unit Sunset Harbour
- 1413 Waterway Dr Unit Lot 60 Sunset Harbou
- 1413 Waterway Dr Unit Lot 60 Sunset Harbor
- 1413 Waterway Dr Unit Lot 60
- Lot 62 Waterway Dr
- 1503 Waterway Dr
- 1503 Waterway Dr Unit Lot 62 Sunset Harbou
- Lot 60 Waterway Dr
- Lot 60 Waterway Dr Unit Sunset Harbour
- 1411 Waterway Dr
- Lot 65 Waterway Dr
- 1505 Waterway Dr
- 1409 Waterway Dr
- 1502 Waterway Dr
- 1500 Waterway Dr
- 1500 Waterway Dr Unit Lot 48 Sunset Harbou
- Lot 64 Waterway Dr Unit Sunset Harbour
- Lot 64 Waterway Dr
- Lot 64 Waterway Dr Unit Lot 64