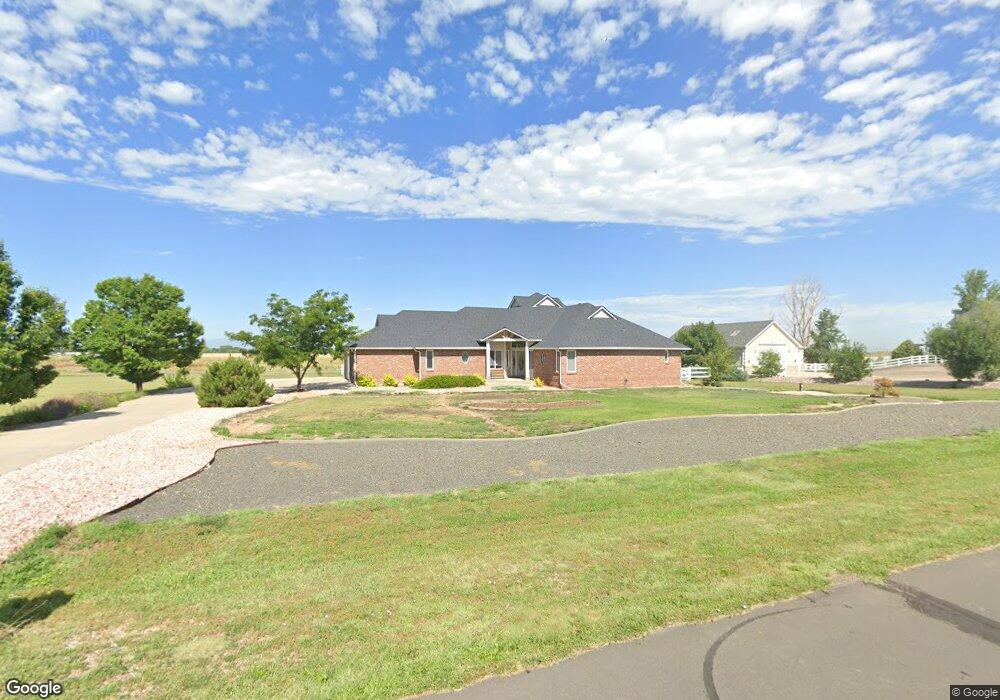
15011 Overland Trail Brighton, CO 80603
Estimated Value: $654,000 - $922,000
3
Beds
5
Baths
2,368
Sq Ft
$340/Sq Ft
Est. Value
About This Home
This home is located at 15011 Overland Trail, Brighton, CO 80603 and is currently estimated at $804,767, approximately $339 per square foot. 15011 Overland Trail is a home located in Weld County with nearby schools including Overland Trail Middle School, Brighton High School, and Foundations Academy.
Ownership History
Date
Name
Owned For
Owner Type
Purchase Details
Closed on
Nov 2, 2017
Sold by
German Florence Lrene and German Mark Joseph
Bought by
German Florence Irene
Current Estimated Value
Purchase Details
Closed on
Dec 30, 1998
Sold by
Grosshans Steven L and Grosshans Janice R
Bought by
German Mark J and German Irene F
Home Financials for this Owner
Home Financials are based on the most recent Mortgage that was taken out on this home.
Original Mortgage
$200,000
Interest Rate
6.74%
Purchase Details
Closed on
Apr 14, 1998
Sold by
Grein Construction Inc
Bought by
Grossland Steven L and Grosslands Janice R
Home Financials for this Owner
Home Financials are based on the most recent Mortgage that was taken out on this home.
Original Mortgage
$253,295
Interest Rate
10%
Mortgage Type
Construction
Purchase Details
Closed on
Jun 23, 1994
Sold by
Grein Ivan E and Grein Joan
Bought by
Grein Construction Inc
Create a Home Valuation Report for This Property
The Home Valuation Report is an in-depth analysis detailing your home's value as well as a comparison with similar homes in the area
Home Values in the Area
Average Home Value in this Area
Purchase History
| Date | Buyer | Sale Price | Title Company |
|---|---|---|---|
| German Florence Irene | -- | None Available | |
| German Mark J | $297,000 | -- | |
| Grossland Steven L | $40,000 | -- | |
| Grein Construction Inc | -- | -- |
Source: Public Records
Mortgage History
| Date | Status | Borrower | Loan Amount |
|---|---|---|---|
| Closed | German Mark J | $200,000 | |
| Previous Owner | Grossland Steven L | $253,295 |
Source: Public Records
Tax History Compared to Growth
Tax History
| Year | Tax Paid | Tax Assessment Tax Assessment Total Assessment is a certain percentage of the fair market value that is determined by local assessors to be the total taxable value of land and additions on the property. | Land | Improvement |
|---|---|---|---|---|
| 2025 | $4,258 | $53,790 | $10,000 | $43,790 |
| 2024 | $4,258 | $53,790 | $10,000 | $43,790 |
| 2023 | $4,063 | $52,740 | $10,820 | $41,920 |
| 2022 | $3,319 | $40,430 | $6,950 | $33,480 |
| 2021 | $3,104 | $41,590 | $7,150 | $34,440 |
| 2020 | $2,300 | $33,080 | $6,080 | $27,000 |
| 2019 | $2,310 | $33,080 | $6,080 | $27,000 |
| 2018 | $2,436 | $34,240 | $9,360 | $24,880 |
| 2017 | $2,429 | $34,240 | $9,360 | $24,880 |
| 2016 | $1,949 | $29,520 | $5,090 | $24,430 |
| 2015 | $1,934 | $29,520 | $5,090 | $24,430 |
| 2014 | $2,573 | $29,180 | $7,080 | $22,100 |
Source: Public Records
Map
Nearby Homes
- 608 Hayloft Way
- 16791 Telluride St
- 4532 Dewey Ln
- 4545 Oxbow Dr
- 445 Tumbleweed Dr
- 4250 Combine Place
- 4649 Spinning Wheel Dr
- 4645 Longs Peak St
- 215 Blue Bonnet Dr Unit 9C
- 3978 Balderas St
- 3938 Balderas St
- 427 Silo Ct
- 256 Homestead Way
- 156 Chapel Hill Cir
- 432 Hedgerow Way
- 4479 Boone Cir
- 535 Meadow Ln
- 4455 Boone Cir
- 147 Chapel Hill Cir
- 4439 Boone Cir
- 0 Wagon Wheel
- 15009 Overland Trail
- 15010 Overland Trail
- 15008 Overland Trail
- 15024 Overland Trail
- 15007 Overland Trail
- 15023 Overland Trail
- 15006 Overland Trail
- 15128 Wagon Wheel Dr
- 15241 Wagon Wheel Dr
- 15005 Overland Trail
- 15044 Overland Trail
- 15242 Wagon Wheel Dr
- 15002 Overland Trail
- 15043 Overland Trail
- 15003 Overland Trail
- 15231 Arrowhead Dr
- 15266 Wagon Wheel Dr
- 15203 Arrowhead Dr
- 15281 Wagon Wheel Dr