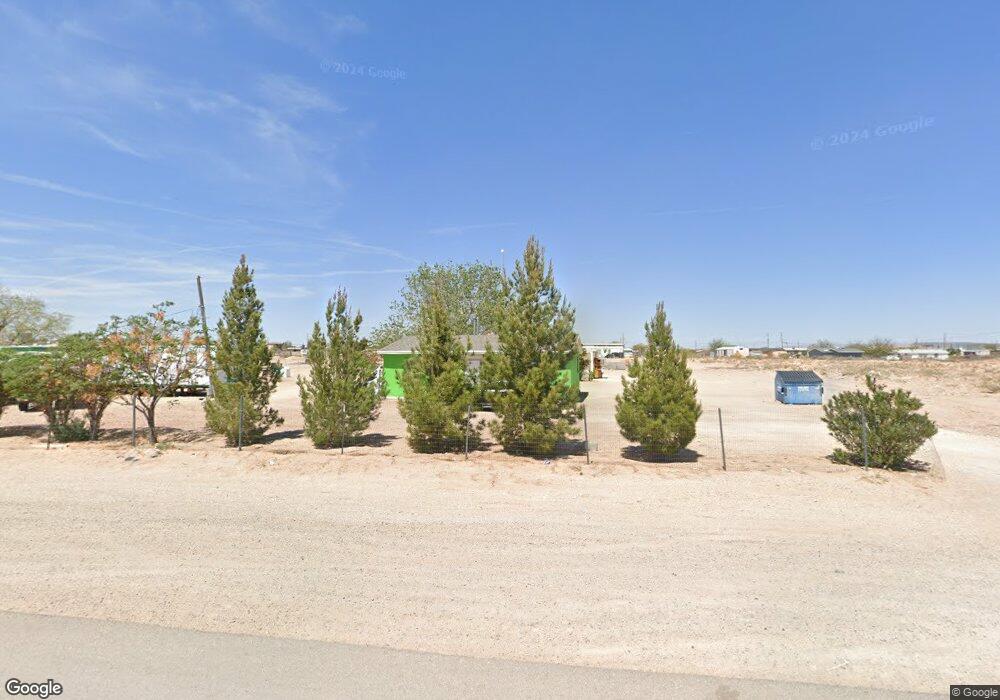
15013 Colonia Granja Dr El Paso, TX 79928
Estimated Value: $128,000 - $228,000
2
Beds
1
Bath
816
Sq Ft
$207/Sq Ft
Est. Value
About This Home
This home is located at 15013 Colonia Granja Dr, El Paso, TX 79928 and is currently estimated at $168,710, approximately $206 per square foot. 15013 Colonia Granja Dr is a home located in El Paso County with nearby schools including William David Surratt Elementary School, Clint Junior High School, and Clint High School.
Ownership History
Date
Name
Owned For
Owner Type
Purchase Details
Closed on
Jul 19, 2019
Sold by
Armendariz Jose Angel
Bought by
Gurrola Eduardo Ordaz
Current Estimated Value
Home Financials for this Owner
Home Financials are based on the most recent Mortgage that was taken out on this home.
Original Mortgage
$88,387
Outstanding Balance
$72,142
Interest Rate
3.82%
Mortgage Type
New Conventional
Estimated Equity
$96,568
Purchase Details
Closed on
May 1, 2015
Sold by
Aguirre Felipe and Aguirre Maria Guadalupe
Bought by
Armendariz Jose A
Purchase Details
Closed on
Jun 25, 2012
Sold by
Armendariz Jose A
Bought by
Aguirre Felipe and Aguirre Maria Guadalupe
Purchase Details
Closed on
Nov 6, 2008
Sold by
Ortiz Mario and Del Billar Elisa
Bought by
Armendariz Jose Angel
Purchase Details
Closed on
May 18, 2007
Sold by
G B Properties
Bought by
Ortiz Mario and Del Billar Elisa
Create a Home Valuation Report for This Property
The Home Valuation Report is an in-depth analysis detailing your home's value as well as a comparison with similar homes in the area
Home Values in the Area
Average Home Value in this Area
Purchase History
| Date | Buyer | Sale Price | Title Company |
|---|---|---|---|
| Gurrola Eduardo Ordaz | -- | None Available | |
| Armendariz Jose A | -- | None Available | |
| Aguirre Felipe | -- | None Available | |
| Armendariz Jose Angel | -- | None Available | |
| Ortiz Mario | -- | None Available |
Source: Public Records
Mortgage History
| Date | Status | Borrower | Loan Amount |
|---|---|---|---|
| Open | Gurrola Eduardo Ordaz | $88,387 |
Source: Public Records
Tax History Compared to Growth
Tax History
| Year | Tax Paid | Tax Assessment Tax Assessment Total Assessment is a certain percentage of the fair market value that is determined by local assessors to be the total taxable value of land and additions on the property. | Land | Improvement |
|---|---|---|---|---|
| 2025 | $1,080 | $116,474 | -- | -- |
| 2024 | $1,080 | $105,885 | -- | -- |
| 2023 | $985 | $96,259 | $0 | $0 |
| 2022 | $2,123 | $89,810 | $21,373 | $68,437 |
| 2021 | $2,084 | $80,724 | $24,288 | $56,436 |
| 2020 | $1,776 | $72,321 | $24,288 | $48,033 |
| 2018 | $1,829 | $72,288 | $24,288 | $48,000 |
| 2017 | $1,238 | $49,281 | $24,288 | $24,993 |
| 2016 | $1,245 | $49,551 | $24,288 | $25,263 |
| 2015 | $1,101 | $49,551 | $24,288 | $25,263 |
| 2014 | $1,101 | $45,247 | $21,648 | $23,599 |
Source: Public Records
Map
Nearby Homes
- 15031 Colonia Campo Rd
- 15030 Colonia Tierra Rd
- 14900 Dairyland Ave
- 15001 Dairyland Ave
- PN- 374462 Mica Tbd Dr
- PN-331881 Tbd
- PN-399643 Tbd
- PN-225950 Tbd
- El paso Tbd
- 0 E El Paso Unit TX 79928
- 2575 Darrington Rd
- 14149 Fortuna St
- PN-158829 Tbd
- 927 Dewsbury Way
- 914 Bromyard Dr
- 13256 Verwood Dr
- 0 Pisecson Ct
- 0 Erickson Unit 899975
- 0 Erickson Unit 927805
- 14400 Diamond Springs Dr
- 15001 Colonia Granja Dr
- 15012 Colonia Granja Dr
- 15025 Colonia Granja Dr
- 15037 Colonia Granja Dr
- 15024 Colonia Granja Dr
- 15018 Colonia Campo Dr
- 15024 Colonia Campo Dr
- 15006 Colonia Campo Dr
- 15030 Colonia Campo Dr
- 15036 Colonia Granja Rd
- 15048 Colonia Granja Dr
- 15036 Colonia Campo Dr
- 15060 Colonia Granja Dr
- 15001 Colonia Campo Dr
- 15019 Colonia Campo Dr
- 15013 Colonia Campo Dr
- 15007 Colonia Campo Dr
- 15007 Colonia Campo Rd
- 15037 Colonia Campo Rd
- 15054 Colonia Campo Dr