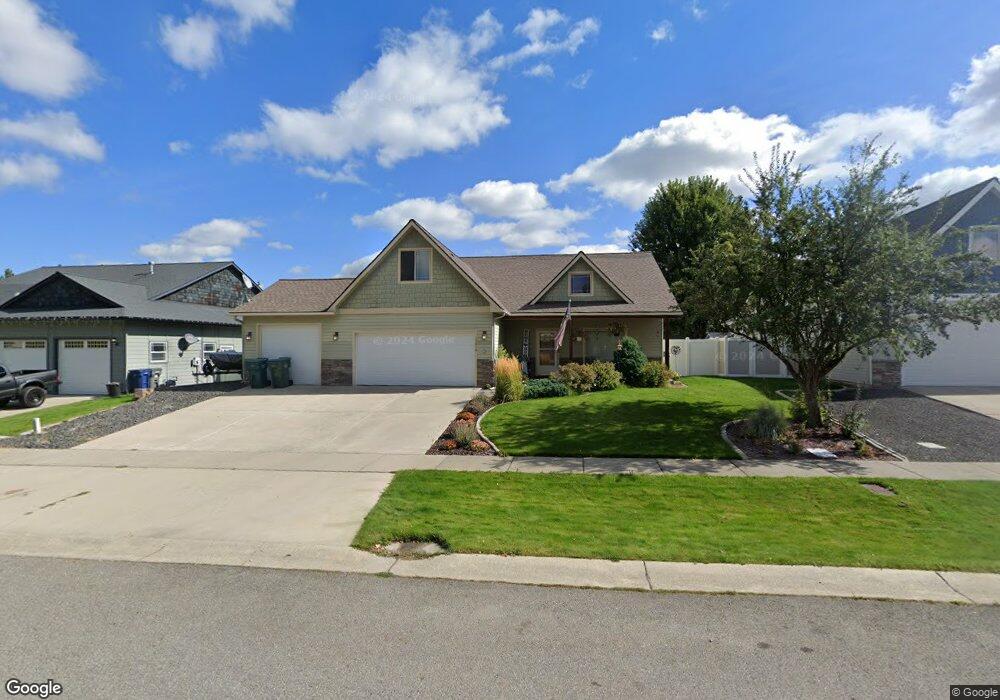
15016 N Nixon Loop Rathdrum, ID 83858
Estimated Value: $497,000 - $530,000
3
Beds
2
Baths
1,858
Sq Ft
$276/Sq Ft
Est. Value
About This Home
This home is located at 15016 N Nixon Loop, Rathdrum, ID 83858 and is currently estimated at $513,529, approximately $276 per square foot. 15016 N Nixon Loop is a home located in Kootenai County with nearby schools including John Brown Elementary School, Lakeland Middle School, and Lakeland Senior High School.
Ownership History
Date
Name
Owned For
Owner Type
Purchase Details
Closed on
Dec 18, 2017
Sold by
Stutheit Geraldine
Bought by
Zucker David S and Zucker Mona L
Current Estimated Value
Home Financials for this Owner
Home Financials are based on the most recent Mortgage that was taken out on this home.
Original Mortgage
$267,563
Outstanding Balance
$224,149
Interest Rate
3.75%
Mortgage Type
FHA
Estimated Equity
$289,380
Purchase Details
Closed on
Oct 3, 2014
Sold by
Stutheit Marty and Stutheit Teena
Bought by
Stutheit Geraldine
Purchase Details
Closed on
Aug 28, 2008
Sold by
Gray James B and Gray Robin
Bought by
Stutheit Geraldine
Home Financials for this Owner
Home Financials are based on the most recent Mortgage that was taken out on this home.
Original Mortgage
$222,069
Interest Rate
6.27%
Mortgage Type
FHA
Purchase Details
Closed on
Aug 29, 2005
Sold by
Waterford Park Homes Llc
Bought by
Gray James B and Gray Mike
Create a Home Valuation Report for This Property
The Home Valuation Report is an in-depth analysis detailing your home's value as well as a comparison with similar homes in the area
Home Values in the Area
Average Home Value in this Area
Purchase History
| Date | Buyer | Sale Price | Title Company |
|---|---|---|---|
| Zucker David S | -- | Alliance Title | |
| Stutheit Geraldine | -- | None Available | |
| Stutheit Geraldine | -- | Pioneer Title Co | |
| Gray James B | -- | -- |
Source: Public Records
Mortgage History
| Date | Status | Borrower | Loan Amount |
|---|---|---|---|
| Open | Zucker David S | $267,563 | |
| Previous Owner | Stutheit Geraldine | $222,069 |
Source: Public Records
Tax History Compared to Growth
Tax History
| Year | Tax Paid | Tax Assessment Tax Assessment Total Assessment is a certain percentage of the fair market value that is determined by local assessors to be the total taxable value of land and additions on the property. | Land | Improvement |
|---|---|---|---|---|
| 2025 | $1,835 | $457,135 | $160,000 | $297,135 |
| 2024 | $1,835 | $456,928 | $160,000 | $296,928 |
| 2023 | $1,835 | $528,494 | $175,000 | $353,494 |
| 2022 | $2,431 | $525,127 | $175,000 | $350,127 |
| 2021 | $2,100 | $323,292 | $98,490 | $224,802 |
| 2020 | $2,135 | $288,004 | $82,075 | $205,929 |
| 2019 | $2,491 | $280,290 | $65,660 | $214,630 |
| 2018 | $3,821 | $244,246 | $57,096 | $187,150 |
| 2017 | $2,066 | $219,580 | $46,800 | $172,780 |
| 2016 | $1,766 | $199,140 | $36,000 | $163,140 |
| 2015 | $1,618 | $185,660 | $30,000 | $155,660 |
| 2013 | $1,535 | $166,870 | $27,540 | $139,330 |
Source: Public Records
Map
Nearby Homes
- 7785 W Meadow Lark Ln
- 13403 Idaho 41
- 7709 W Meadow Lark Ln
- 15360 N Nixon Loop
- NKA N Ohio St
- 14318 N Rockwood Ct
- 11535 N Entwistle Way
- 16167 N Hadley Loop
- 11559 N Entwistle Way
- 11556 N Entwistle Way
- 8270 W Meadow Brook
- 15036 N Anthony
- 8475 W Meadow Brook
- 8102 W Arizona St
- 15272 N Stevens St
- 8745 W Meadow Brook Cir
- 7164 W Winchester St
- 15320 N Stevens St
- 15158 N Wright St
- 6760 W Portrush Dr
- 14990 N Nixon Loop
- 15040 N Nixon Loop
- 14649 N Ohio St
- LOT 3 Nixon Loop
- LOT 2 Nixon Loop
- 14968 Nixon Loop
- LOT 1 Nixon Loop
- 0 Nixon Loop
- nna Nixon Loop
- Lot 4 Nixon Loop
- Lot 5 Nixon Loop
- 14585 N Ohio St
- 15015 Nixon Loop
- 15027 Nixon Loop
- 15015 N Nixon Loop
- 15041 Nixon Loop
- 15041 N Nixon Loop
- 15005 Nixon Loop
- 15045 N Nixon Loop
- 14991 N Nixon Loop