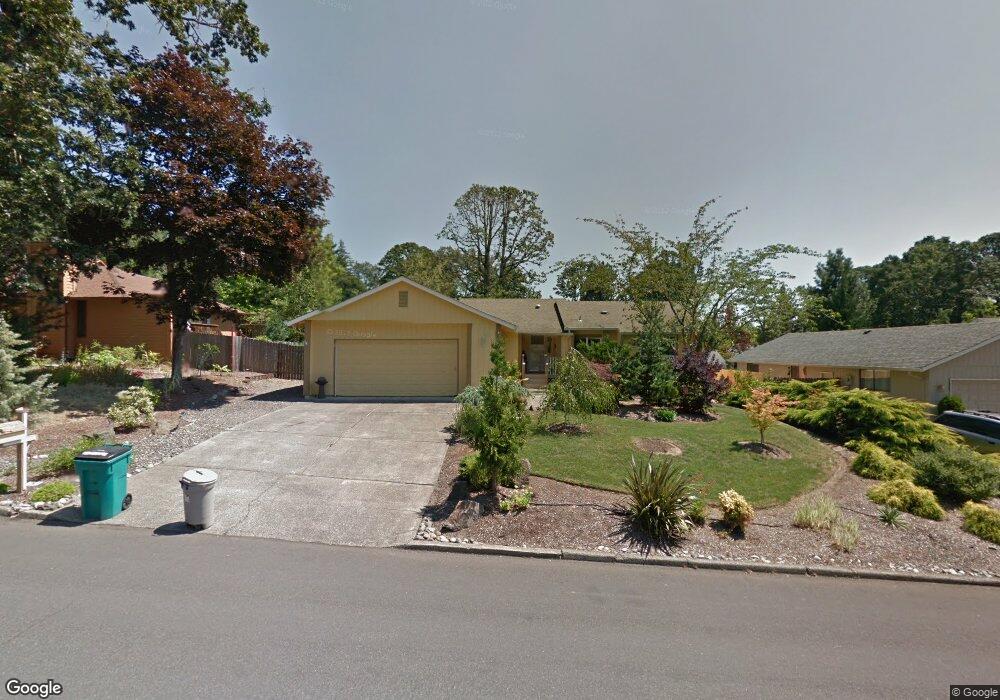
15017 NE 27th Ave Vancouver, WA 98686
Estimated Value: $503,000 - $563,000
3
Beds
2
Baths
1,442
Sq Ft
$369/Sq Ft
Est. Value
About This Home
This home is located at 15017 NE 27th Ave, Vancouver, WA 98686 and is currently estimated at $531,964, approximately $368 per square foot. 15017 NE 27th Ave is a home located in Clark County with nearby schools including Pleasant Valley Primary School, Pleasant Valley Middle School, and Prairie High School.
Ownership History
Date
Name
Owned For
Owner Type
Purchase Details
Closed on
Dec 14, 2005
Sold by
Kelsey Jan and Isaacs Janis K
Bought by
Smith Loretta J
Current Estimated Value
Home Financials for this Owner
Home Financials are based on the most recent Mortgage that was taken out on this home.
Original Mortgage
$75,000
Outstanding Balance
$1,642
Interest Rate
6.36%
Mortgage Type
Credit Line Revolving
Estimated Equity
$530,322
Purchase Details
Closed on
Sep 8, 2005
Sold by
Isaacs David K
Bought by
Isaacs Janis K
Purchase Details
Closed on
Aug 6, 2001
Sold by
Bardy David Michael and Bardy David M
Bought by
Isaacs David K and Isaacs Janis K
Home Financials for this Owner
Home Financials are based on the most recent Mortgage that was taken out on this home.
Original Mortgage
$118,400
Interest Rate
8.12%
Create a Home Valuation Report for This Property
The Home Valuation Report is an in-depth analysis detailing your home's value as well as a comparison with similar homes in the area
Home Values in the Area
Average Home Value in this Area
Purchase History
| Date | Buyer | Sale Price | Title Company |
|---|---|---|---|
| Smith Loretta J | $234,900 | Clark County Title Co | |
| Isaacs Janis K | -- | -- | |
| Isaacs David K | $148,000 | Clark County Title Company |
Source: Public Records
Mortgage History
| Date | Status | Borrower | Loan Amount |
|---|---|---|---|
| Open | Smith Loretta J | $75,000 | |
| Open | Smith Loretta J | $136,175 | |
| Previous Owner | Isaacs David K | $118,400 | |
| Closed | Isaacs David K | $29,600 |
Source: Public Records
Tax History Compared to Growth
Tax History
| Year | Tax Paid | Tax Assessment Tax Assessment Total Assessment is a certain percentage of the fair market value that is determined by local assessors to be the total taxable value of land and additions on the property. | Land | Improvement |
|---|---|---|---|---|
| 2025 | $4,442 | $521,411 | $252,450 | $268,961 |
| 2024 | $3,893 | $484,823 | $252,450 | $232,373 |
| 2023 | $4,074 | $500,716 | $244,800 | $255,916 |
| 2022 | $3,648 | $464,263 | $244,800 | $219,463 |
| 2021 | $3,651 | $365,814 | $156,750 | $209,064 |
| 2020 | $3,518 | $332,702 | $145,350 | $187,352 |
| 2019 | $2,968 | $323,780 | $150,100 | $173,680 |
| 2018 | $3,398 | $308,283 | $0 | $0 |
| 2017 | $2,946 | $269,710 | $0 | $0 |
| 2016 | $2,893 | $247,236 | $0 | $0 |
| 2015 | $2,751 | $224,976 | $0 | $0 |
| 2014 | -- | $206,964 | $0 | $0 |
| 2013 | -- | $193,071 | $0 | $0 |
Source: Public Records
Map
Nearby Homes
- 17712 NE 25th Ct Unit LOT 2
- 15108 NE 22nd Ave
- 2113 NE 152nd St
- 14518 NE 24th Ave
- 2513 NE 158th St
- 14605 NE 20th Ave Unit B101
- 14609 NE 20th Ave Unit C203
- 2519 NE 159th St
- 15711 NE 22nd Ave
- 2707 NE 159th Cir
- 2722 NE 159th Cir
- 2012 NE 159th St
- 14019 NE 20th Ave Unit 54G
- 14019 NE 20th Ave Unit E44
- 2202 NE 140th St
- 2202 NE 140th St Unit Lot 44
- 16210 NE 27th Ave
- 13915 NE 23rd Ave
- 1716 NE 146th St
- 13912 NE 23rd Ave
- 15011 NE 27th Ave
- 15103 NE 27th Ave
- 15016 NE 28th Ct
- 15010 NE 28th Ct
- 15100 NE 28th Ct
- 15109 NE 27th Ave
- 15016 NE 27th Ave
- 15100 NE 27th Ave
- 15010 NE 27th Ave
- 15106 NE 28th Ct
- 15108 NE 27th Ave
- 2709 NE 150th St
- 15115 NE 27th Ave
- 2703 NE 150th St
- 2715 NE 150th St
- 15017 NE 28th Ct
- 15112 NE 28th Ct
- 15007 NE 26th Ct
- 2621 NE 150th St
- 2806 NE 150th St