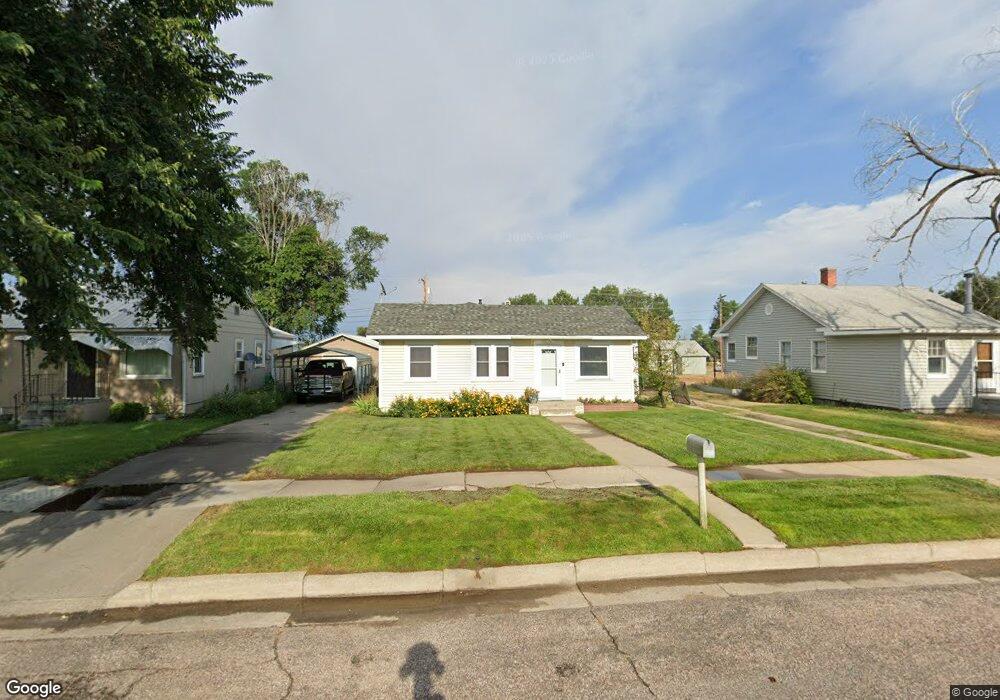
1502 11th St Wheatland, WY 82201
Estimated Value: $172,000 - $189,000
2
Beds
1
Bath
1,092
Sq Ft
$162/Sq Ft
Est. Value
About This Home
This home is located at 1502 11th St, Wheatland, WY 82201 and is currently estimated at $177,445, approximately $162 per square foot. 1502 11th St is a home located in Platte County.
Ownership History
Date
Name
Owned For
Owner Type
Purchase Details
Closed on
May 22, 2023
Sold by
Harris Jared Cory and Harris Jennifer Mary
Bought by
Harris Jared Cory
Current Estimated Value
Home Financials for this Owner
Home Financials are based on the most recent Mortgage that was taken out on this home.
Original Mortgage
$105,500
Outstanding Balance
$94,253
Interest Rate
5.54%
Mortgage Type
New Conventional
Estimated Equity
$83,192
Purchase Details
Closed on
Feb 25, 2010
Sold by
Rowe Nora Catherine and Rowe Dewitt C
Bought by
Harris Jared Cory and Harris Jennifer Mary
Home Financials for this Owner
Home Financials are based on the most recent Mortgage that was taken out on this home.
Original Mortgage
$88,740
Interest Rate
4.97%
Purchase Details
Closed on
Dec 29, 2006
Sold by
Johnston Amy F
Bought by
Rowe Nora Catharine and Rowe Dewitt C
Home Financials for this Owner
Home Financials are based on the most recent Mortgage that was taken out on this home.
Original Mortgage
$45,500
Interest Rate
6.1%
Create a Home Valuation Report for This Property
The Home Valuation Report is an in-depth analysis detailing your home's value as well as a comparison with similar homes in the area
Home Values in the Area
Average Home Value in this Area
Purchase History
| Date | Buyer | Sale Price | Title Company |
|---|---|---|---|
| Harris Jared Cory | -- | None Listed On Document | |
| Harris Jared Cory | -- | -- | |
| Rowe Nora Catharine | -- | -- |
Source: Public Records
Mortgage History
| Date | Status | Borrower | Loan Amount |
|---|---|---|---|
| Open | Harris Jared Cory | $105,500 | |
| Previous Owner | Harris Jared Cory | $88,740 | |
| Previous Owner | Rowe Nora Catharine | $45,500 |
Source: Public Records
Tax History Compared to Growth
Tax History
| Year | Tax Paid | Tax Assessment Tax Assessment Total Assessment is a certain percentage of the fair market value that is determined by local assessors to be the total taxable value of land and additions on the property. | Land | Improvement |
|---|---|---|---|---|
| 2025 | $1,301 | $13,459 | $1,027 | $12,432 |
| 2024 | $1,301 | $17,821 | $1,317 | $16,504 |
| 2023 | $1,265 | $17,332 | $1,164 | $16,168 |
| 2022 | $1,165 | $15,334 | $1,164 | $14,170 |
| 2021 | $966 | $12,709 | $1,097 | $11,612 |
| 2020 | $938 | $12,342 | $1,097 | $11,245 |
| 2019 | $886 | $11,729 | $1,097 | $10,632 |
| 2018 | $821 | $10,878 | $1,097 | $9,781 |
| 2017 | $824 | $10,916 | $1,097 | $9,819 |
| 2016 | $706 | $9,346 | $1,097 | $8,249 |
| 2015 | $638 | $9,319 | $1,097 | $8,222 |
| 2014 | $638 | $8,481 | $1,097 | $7,384 |
Source: Public Records
Map
Nearby Homes