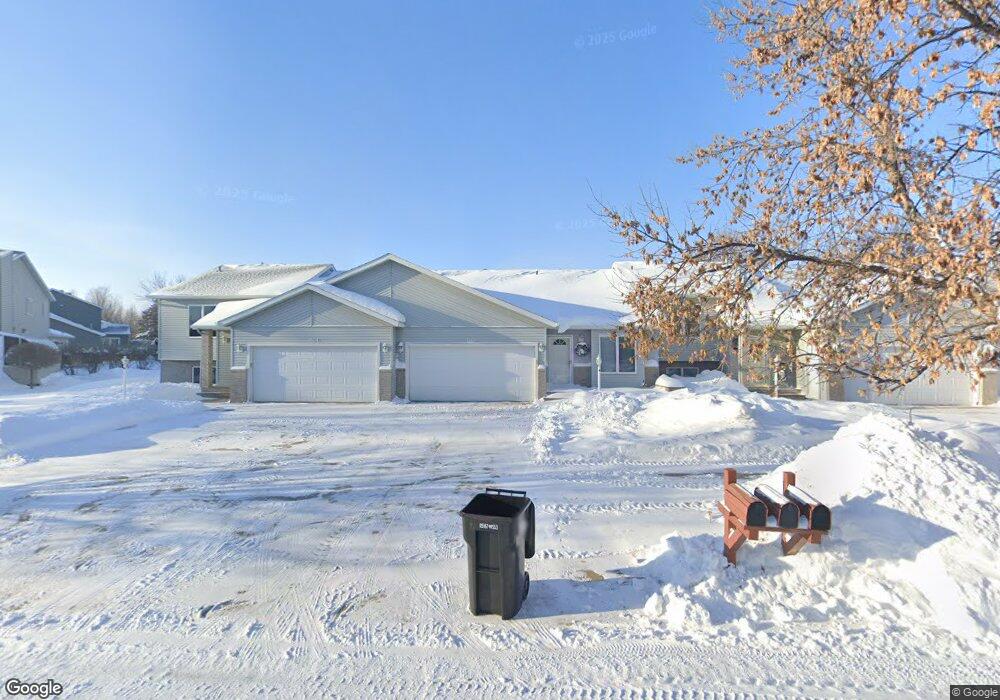
1502 14th St E West Fargo, ND 58078
Tintes NeighborhoodEstimated Value: $267,352 - $270,000
3
Beds
2
Baths
1,662
Sq Ft
$162/Sq Ft
Est. Value
About This Home
This home is located at 1502 14th St E, West Fargo, ND 58078 and is currently estimated at $268,676, approximately $161 per square foot. 1502 14th St E is a home located in Cass County with nearby schools including Willow Park Elementary School, Cheney Middle School, and West Fargo High School.
Ownership History
Date
Name
Owned For
Owner Type
Purchase Details
Closed on
Sep 5, 2024
Sold by
Casavant Michael and Casavant Valerie
Bought by
Casavant Devin and Casavant Adelle
Current Estimated Value
Purchase Details
Closed on
Jan 3, 2020
Sold by
Cieslak Jordan A
Bought by
Casavant Michael and Casavant Valerie
Purchase Details
Closed on
Dec 18, 2015
Sold by
Schmitz Jacob and Schmitz Mikala
Bought by
Cleslak Jordan A
Home Financials for this Owner
Home Financials are based on the most recent Mortgage that was taken out on this home.
Original Mortgage
$148,900
Interest Rate
3.96%
Mortgage Type
New Conventional
Purchase Details
Closed on
Apr 29, 2009
Sold by
Schmit James E and Schmit Glenda L
Bought by
Hanes Susan C
Home Financials for this Owner
Home Financials are based on the most recent Mortgage that was taken out on this home.
Original Mortgage
$116,800
Interest Rate
4.85%
Mortgage Type
New Conventional
Create a Home Valuation Report for This Property
The Home Valuation Report is an in-depth analysis detailing your home's value as well as a comparison with similar homes in the area
Home Values in the Area
Average Home Value in this Area
Purchase History
| Date | Buyer | Sale Price | Title Company |
|---|---|---|---|
| Casavant Devin | -- | None Listed On Document | |
| Casavant Michael | $185,000 | Onpoint Title Services Llc | |
| Cleslak Jordan A | $174,900 | Title Co | |
| Hanes Susan C | -- | -- |
Source: Public Records
Mortgage History
| Date | Status | Borrower | Loan Amount |
|---|---|---|---|
| Previous Owner | Cleslak Jordan A | $148,900 | |
| Previous Owner | Hanes Susan C | $116,800 |
Source: Public Records
Tax History
| Year | Tax Paid | Tax Assessment Tax Assessment Total Assessment is a certain percentage of the fair market value that is determined by local assessors to be the total taxable value of land and additions on the property. | Land | Improvement |
|---|---|---|---|---|
| 2024 | $2,768 | $115,800 | $19,500 | $96,300 |
| 2023 | $3,197 | $112,800 | $19,500 | $93,300 |
| 2022 | $3,096 | $105,150 | $19,500 | $85,650 |
| 2021 | $2,824 | $92,200 | $12,500 | $79,700 |
| 2020 | $2,766 | $94,700 | $12,500 | $82,200 |
| 2019 | $2,501 | $91,600 | $12,500 | $79,100 |
| 2018 | $2,453 | $93,100 | $12,500 | $80,600 |
| 2017 | $2,397 | $93,100 | $12,500 | $80,600 |
| 2016 | $2,028 | $86,850 | $12,500 | $74,350 |
| 2015 | $2,131 | $77,850 | $7,600 | $70,250 |
| 2014 | $2,092 | $72,750 | $7,600 | $65,150 |
| 2013 | $2,127 | $72,750 | $7,600 | $65,150 |
Source: Public Records
Map
Nearby Homes
- 1424 14th St E Unit 11
- 1409 Heatherwood Ct
- 868 Lakeridge Place
- 783 14 1 2 Ave E
- 790 Lakeridge Dr
- 1755 Huntington Dr
- 1511 11th Ave E
- 1829 13th St E
- 722 14 1 2 Ave E
- 1423 10th Ave E Unit 206
- 1884 Huntington Ln
- 801 9th St E
- 715 Northridge Way
- 602 12 1 2 Ave E Unit 5
- 921 Homestead Ct
- 1842 52nd St S
- 622 12th Ave E
- 1811 7th St E
- 1827 7th St E
- 1059 Sommerset Place
- 1504 14th St E
- 1500 14th St E
- 1209 Cedar Way
- 1469 12th Street Ct
- 1467 12th Street Ct
- 1469 12 St Ct St E
- 1415 12th Street Ct
- 1205 Cedar Way
- 1463 12th Street Ct
- 1460 14th St E
- 1417 12th Street Ct
- 1401 15th Ave E
- 1458 14th St E
- 1419 12th Street Ct
- 1461 12th Street Ct
- 1212 Cedar Way
- 1208 Cedar Way
- 1220 Cedar Way
- 1405 15th Ave E
- 1515 14th St E
Your Personal Tour Guide
Ask me questions while you tour the home.