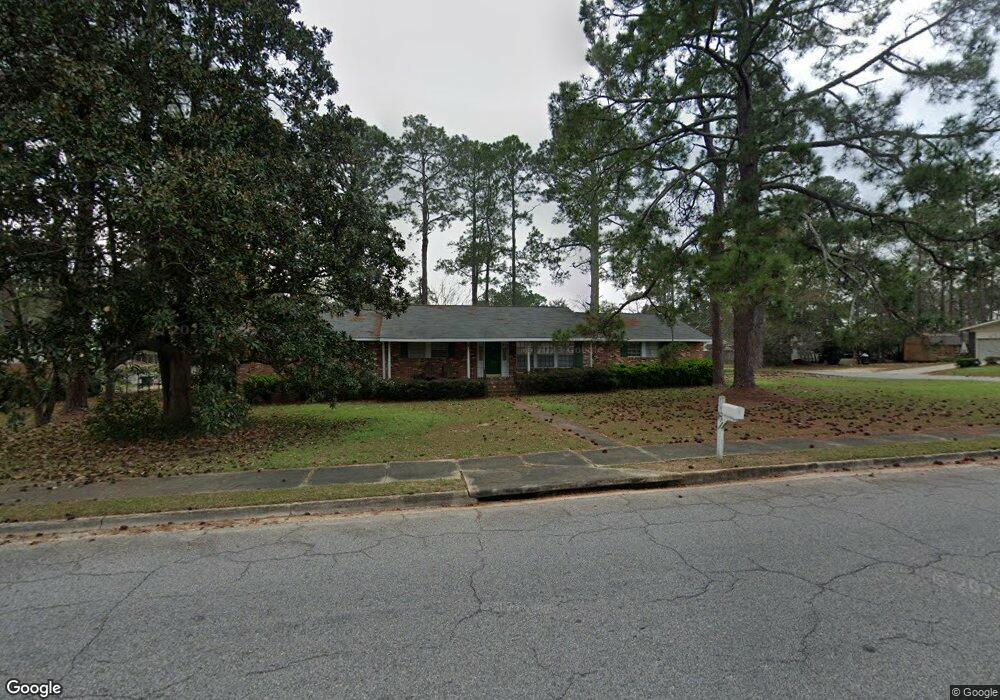
1502 E 24th Ave Cordele, GA 31015
Estimated Value: $191,425 - $267,000
4
Beds
2
Baths
2,336
Sq Ft
$99/Sq Ft
Est. Value
About This Home
This home is located at 1502 E 24th Ave, Cordele, GA 31015 and is currently estimated at $232,106, approximately $99 per square foot. 1502 E 24th Ave is a home located in Crisp County with nearby schools including Crisp County Elementary School, Crisp County Primary School, and Crisp County Middle School.
Ownership History
Date
Name
Owned For
Owner Type
Purchase Details
Closed on
Aug 27, 2024
Sold by
Cooke Robert B
Bought by
Cooke James Benjamin and Cooke Olivia Falon
Current Estimated Value
Purchase Details
Closed on
Jul 10, 2008
Sold by
Cooke Mary Elizabeth
Bought by
Cooke Robert B
Purchase Details
Closed on
Jun 19, 2000
Sold by
Houston Jeff
Bought by
Cooks Robert and Cooks Mary
Purchase Details
Closed on
Jan 23, 1998
Sold by
Houston Jeff and Houston Lisa
Bought by
Houston Jeff
Purchase Details
Closed on
Mar 28, 1991
Sold by
Bringman J Etal
Bought by
Houston Jeff and Houston Lisa
Purchase Details
Closed on
Mar 3, 1989
Bought by
Bringman J Etal
Create a Home Valuation Report for This Property
The Home Valuation Report is an in-depth analysis detailing your home's value as well as a comparison with similar homes in the area
Purchase History
| Date | Buyer | Sale Price | Title Company |
|---|---|---|---|
| Cooke James Benjamin | -- | -- | |
| Cooke Robert B | -- | -- | |
| Cooks Robert | $95,900 | -- | |
| Houston Jeff | -- | -- | |
| Houston Jeff | $64,000 | -- | |
| Bringman J Etal | -- | -- |
Source: Public Records
Tax History
| Year | Tax Paid | Tax Assessment Tax Assessment Total Assessment is a certain percentage of the fair market value that is determined by local assessors to be the total taxable value of land and additions on the property. | Land | Improvement |
|---|---|---|---|---|
| 2025 | $2,563 | $72,668 | $5,600 | $67,068 |
| 2024 | $2,317 | $66,034 | $5,600 | $60,434 |
| 2023 | $2,299 | $62,717 | $5,600 | $57,117 |
| 2022 | $1,517 | $59,400 | $5,600 | $53,800 |
| 2021 | $1,487 | $56,083 | $5,600 | $50,483 |
| 2020 | $1,522 | $56,083 | $5,600 | $50,483 |
| 2019 | $1,534 | $56,083 | $5,600 | $50,483 |
| 2018 | $1,237 | $43,968 | $5,600 | $38,368 |
| 2017 | $1,785 | $43,968 | $5,600 | $38,368 |
| 2016 | $1,241 | $43,968 | $5,600 | $38,368 |
| 2015 | -- | $43,968 | $5,600 | $38,368 |
| 2014 | -- | $43,968 | $5,600 | $38,368 |
| 2013 | -- | $43,968 | $5,600 | $38,368 |
Source: Public Records
Map
Nearby Homes
- 1506 E 24th Ave
- 1410 E 24th Ave
- 1603 Pine Acres Dr
- 1614 Pryor Way
- 1304 Robin St
- 1001 Stewart Ave
- 1207 Fleming Rd
- 1012 E 21st Ave
- 1018 E 28th Ave
- 1206 Fleming Rd
- 912 Rose Ln
- E 8th Ave
- 1403 Georgia 90
- 709 Fleming Rd
- 723 E 24th Ave
- 1002 Camellia Dr
- 720 E 20th Ave
- 708 E 26th Ave Unit 4&5
- 708 E 26th Ave
- 716 E 18th Ave
- 1501 Pine Acres Dr
- 1418 E 24th Ave
- 1505 Pine Acres Dr
- 1505 Pine Acres Dr
- 1419 Pine Acres Dr
- 1505 E 24th Ave
- 1503 Pine Acres Dr
- 1414 E 24th Ave
- 1510 E 24th Ave
- 1413 Pine Acres Dr
- 1506 Pine Acres Dr
- 1502 Pine Acres Dr
- 1414 Pine Acres Dr
- 1405 Pine Acres Dr
- 1510 Pine Acres Dr
- 1606 E 24th Ave
- 1406 E 24th Ave
- 1403 Pine Acres Dr
- 1410 Pine Acres Dr
- 1604 Goff Cir
Your Personal Tour Guide
Ask me questions while you tour the home.