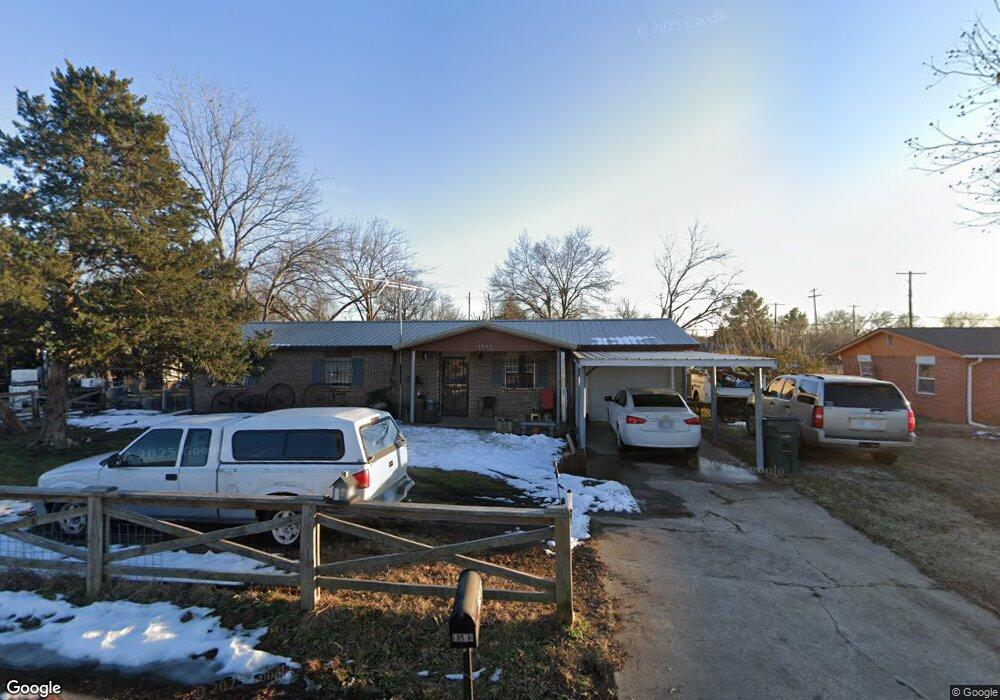
1502 E 3rd St Okmulgee, OK 74447
Estimated Value: $52,000 - $95,000
4
Beds
1
Bath
1,104
Sq Ft
$69/Sq Ft
Est. Value
About This Home
This home is located at 1502 E 3rd St, Okmulgee, OK 74447 and is currently estimated at $75,879, approximately $68 per square foot. 1502 E 3rd St is a home located in Okmulgee County with nearby schools including Okmulgee Primary School, Dunbar Elementary School, and Okmulgee Middle School.
Ownership History
Date
Name
Owned For
Owner Type
Purchase Details
Closed on
Sep 20, 2007
Sold by
Mccarty Michael
Bought by
Miller Clifford and Miller Nyleca
Current Estimated Value
Home Financials for this Owner
Home Financials are based on the most recent Mortgage that was taken out on this home.
Original Mortgage
$40,400
Outstanding Balance
$25,317
Interest Rate
6.55%
Mortgage Type
New Conventional
Estimated Equity
$50,562
Purchase Details
Closed on
Oct 3, 2006
Sold by
Ingomar Lp
Bought by
Mccarty Michael
Purchase Details
Closed on
Sep 27, 2006
Sold by
Nationscredit Home Equity Services
Bought by
Ingomar Lp
Purchase Details
Closed on
Feb 27, 2006
Sold by
Jones Dick G and Jones Dick Gregory
Bought by
Nations Credit Home Equity Services
Create a Home Valuation Report for This Property
The Home Valuation Report is an in-depth analysis detailing your home's value as well as a comparison with similar homes in the area
Home Values in the Area
Average Home Value in this Area
Purchase History
| Date | Buyer | Sale Price | Title Company |
|---|---|---|---|
| Miller Clifford | $50,500 | None Available | |
| Mccarty Michael | $23,000 | Oklahoma Reo Closing & Title | |
| Ingomar Lp | -- | Oklahoma Reo Closing & Title | |
| Nations Credit Home Equity Services | $33,078 | None Available |
Source: Public Records
Mortgage History
| Date | Status | Borrower | Loan Amount |
|---|---|---|---|
| Open | Miller Clifford | $40,400 |
Source: Public Records
Tax History
| Year | Tax Paid | Tax Assessment Tax Assessment Total Assessment is a certain percentage of the fair market value that is determined by local assessors to be the total taxable value of land and additions on the property. | Land | Improvement |
|---|---|---|---|---|
| 2025 | $435 | $4,748 | $323 | $4,425 |
| 2024 | $409 | $4,748 | $323 | $4,425 |
| 2023 | $366 | $4,307 | $323 | $3,984 |
| 2022 | $364 | $4,307 | $323 | $3,984 |
| 2021 | $381 | $4,307 | $323 | $3,984 |
| 2020 | $390 | $4,404 | $323 | $4,081 |
| 2019 | $405 | $4,581 | $323 | $4,258 |
| 2018 | $486 | $5,426 | $323 | $5,103 |
| 2017 | $483 | $5,460 | $323 | $5,137 |
| 2016 | $538 | $6,060 | $323 | $5,737 |
| 2015 | $522 | $6,060 | $323 | $5,737 |
| 2014 | $525 | $6,060 | $323 | $5,737 |
Source: Public Records
Map
Nearby Homes
Your Personal Tour Guide
Ask me questions while you tour the home.