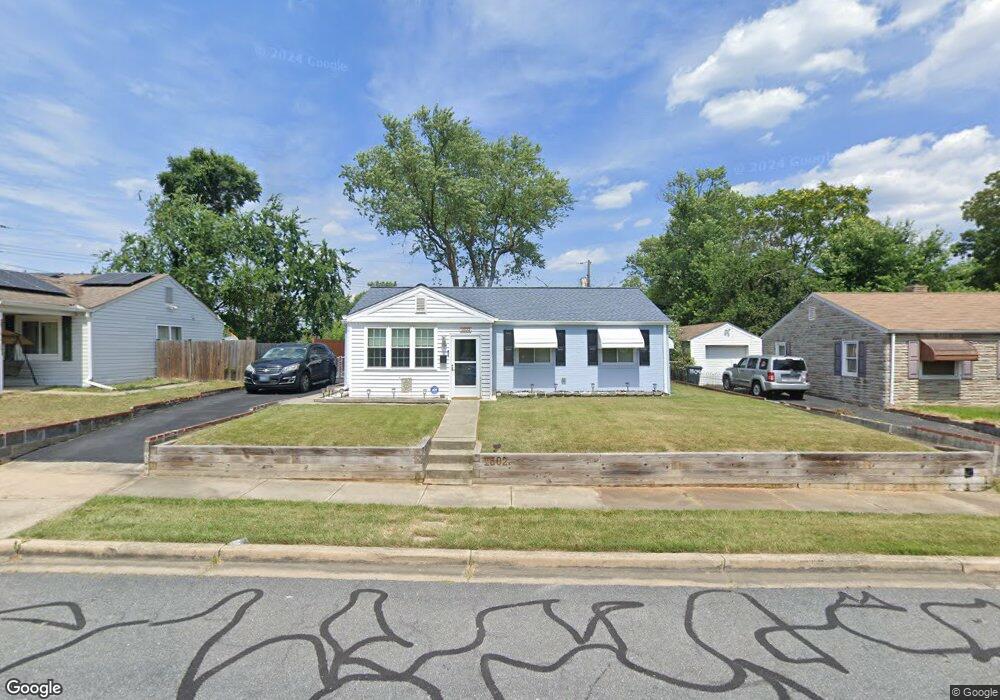
1502 Eastway Glen Burnie, MD 21060
Estimated Value: $254,723 - $337,000
--
Bed
1
Bath
988
Sq Ft
$312/Sq Ft
Est. Value
About This Home
This home is located at 1502 Eastway, Glen Burnie, MD 21060 and is currently estimated at $307,931, approximately $311 per square foot. 1502 Eastway is a home located in Anne Arundel County with nearby schools including Glendale Elementary School, Marley Middle School, and Glen Burnie High School.
Ownership History
Date
Name
Owned For
Owner Type
Purchase Details
Closed on
Apr 11, 1994
Sold by
Hogarty H J
Bought by
Evans J Y
Current Estimated Value
Home Financials for this Owner
Home Financials are based on the most recent Mortgage that was taken out on this home.
Original Mortgage
$96,554
Interest Rate
7.27%
Purchase Details
Closed on
Jul 26, 1988
Sold by
Werner James J
Bought by
Hogarty Herbert J
Home Financials for this Owner
Home Financials are based on the most recent Mortgage that was taken out on this home.
Original Mortgage
$75,250
Interest Rate
10.46%
Create a Home Valuation Report for This Property
The Home Valuation Report is an in-depth analysis detailing your home's value as well as a comparison with similar homes in the area
Home Values in the Area
Average Home Value in this Area
Purchase History
| Date | Buyer | Sale Price | Title Company |
|---|---|---|---|
| Evans J Y | $95,900 | -- | |
| Hogarty Herbert J | $72,900 | -- |
Source: Public Records
Mortgage History
| Date | Status | Borrower | Loan Amount |
|---|---|---|---|
| Closed | Evans J Y | $96,554 | |
| Previous Owner | Hogarty Herbert J | $75,250 |
Source: Public Records
Tax History Compared to Growth
Tax History
| Year | Tax Paid | Tax Assessment Tax Assessment Total Assessment is a certain percentage of the fair market value that is determined by local assessors to be the total taxable value of land and additions on the property. | Land | Improvement |
|---|---|---|---|---|
| 2025 | $2,157 | $241,000 | $145,300 | $95,700 |
| 2024 | $2,157 | $227,233 | $0 | $0 |
| 2023 | $2,081 | $213,467 | $0 | $0 |
| 2022 | $1,931 | $199,700 | $115,300 | $84,400 |
| 2021 | $1,831 | $195,533 | $0 | $0 |
| 2020 | $1,831 | $191,367 | $0 | $0 |
| 2019 | $1,803 | $187,200 | $105,300 | $81,900 |
| 2018 | $1,860 | $183,400 | $0 | $0 |
| 2017 | $1,709 | $179,600 | $0 | $0 |
| 2016 | -- | $175,800 | $0 | $0 |
| 2015 | -- | $168,700 | $0 | $0 |
| 2014 | -- | $161,600 | $0 | $0 |
Source: Public Records
Map
Nearby Homes
- 1613 Kimber Rd
- 1612 Lorimer Rd
- 1702 Manning Rd
- 1701 Norfolk Rd
- 1731 Saunders Way
- 1017 Thomas Rd
- 1003 Lee Rd
- 201 Nina Ct
- 0 Irene Dr
- 45 Chester Cir
- 713 Cotter Rd
- 8918 Twin Ridge Dr
- 1921 Norwich Rd
- 8903 Jeff Mar Dr
- 405 Morningside Dr
- 809 Bunch Ave
- 1909 Pagham Rd
- 8906 Jeff Mar Dr
- 912 Oakwood Rd
- 206 Sandsbury Ave