Estimated Value: $151,000 - $174,000
3
Beds
1
Bath
1,640
Sq Ft
$100/Sq Ft
Est. Value
About This Home
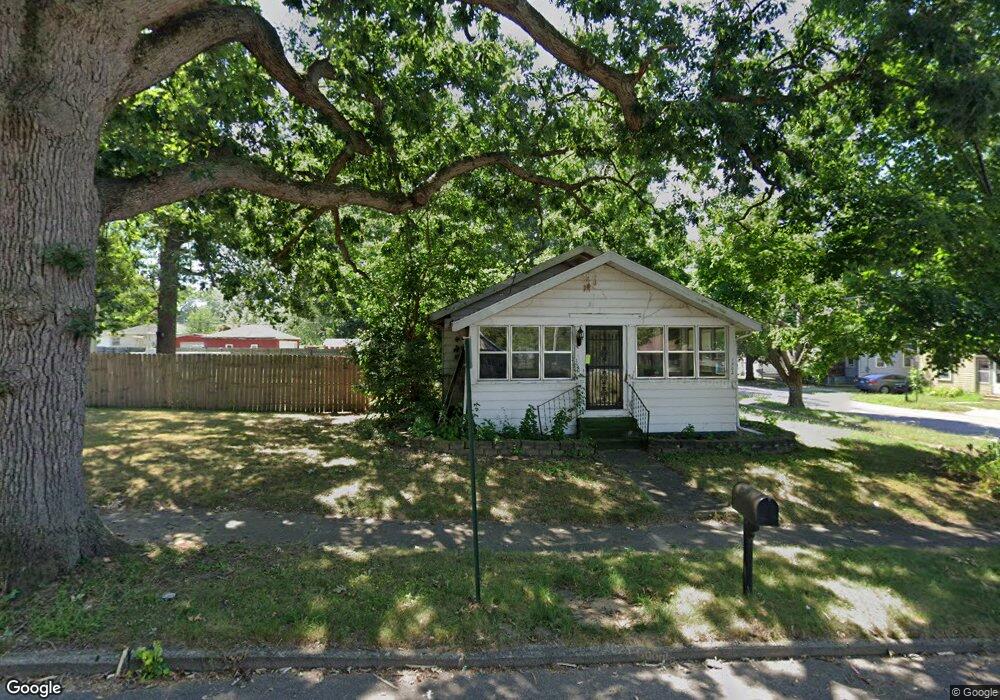
This home is located at 1502 Maple St, Niles, MI 49120 and is currently estimated at $163,587, approximately $99 per square foot. 1502 Maple St is a home located in Berrien County with nearby schools including James Ellis School, Howard-Ellis Elementary School, and Oak Manor Sixth Grade Center.
Ownership History
Date
Name
Owned For
Owner Type
Purchase Details
Closed on
Mar 11, 2010
Sold by
Powers Kaloup and Powers Deanna
Bought by
Aviles Ronald
Current Estimated Value
Home Financials for this Owner
Home Financials are based on the most recent Mortgage that was taken out on this home.
Original Mortgage
$57,488
Interest Rate
5.5%
Mortgage Type
FHA
Purchase Details
Closed on
Feb 20, 2002
Purchase Details
Closed on
Jul 21, 1980
Create a Home Valuation Report for This Property
The Home Valuation Report is an in-depth analysis detailing your home's value as well as a comparison with similar homes in the area
Home Values in the Area
Average Home Value in this Area
Purchase History
| Date | Buyer | Sale Price | Title Company |
|---|---|---|---|
| Aviles Ronald | $76,500 | First American Title | |
| -- | $66,000 | -- | |
| -- | $31,000 | -- |
Source: Public Records
Mortgage History
| Date | Status | Borrower | Loan Amount |
|---|---|---|---|
| Closed | Aviles Ronald | $57,488 |
Source: Public Records
Tax History Compared to Growth
Tax History
| Year | Tax Paid | Tax Assessment Tax Assessment Total Assessment is a certain percentage of the fair market value that is determined by local assessors to be the total taxable value of land and additions on the property. | Land | Improvement |
|---|---|---|---|---|
| 2025 | $1,366 | $76,700 | $0 | $0 |
| 2024 | $1,070 | $71,300 | $0 | $0 |
| 2023 | $1,025 | $62,400 | $0 | $0 |
| 2022 | $977 | $58,100 | $0 | $0 |
| 2021 | $1,254 | $54,200 | $3,100 | $51,100 |
| 2020 | $1,241 | $43,300 | $0 | $0 |
| 2019 | $1,172 | $45,900 | $8,500 | $37,400 |
| 2018 | $1,134 | $45,900 | $0 | $0 |
| 2017 | $1,115 | $41,800 | $0 | $0 |
| 2016 | $1,091 | $34,000 | $0 | $0 |
| 2015 | $1,088 | $30,800 | $0 | $0 |
| 2014 | $848 | $30,700 | $0 | $0 |
Source: Public Records
Map
Nearby Homes