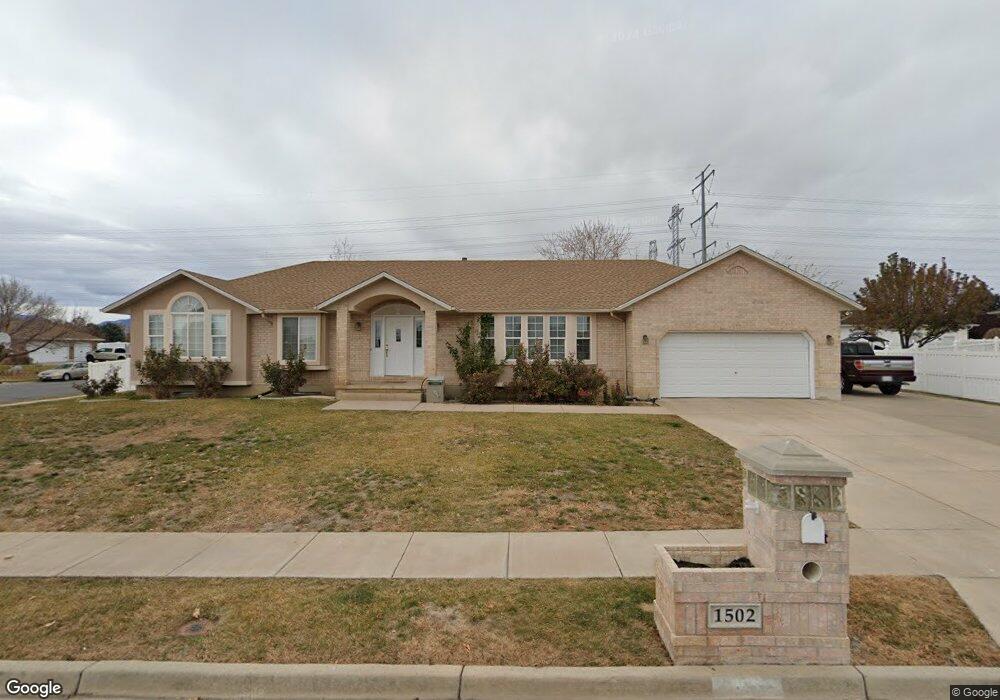
1502 N 1750 W Clearfield, UT 84015
Estimated Value: $569,000 - $629,000
7
Beds
4
Baths
3,662
Sq Ft
$163/Sq Ft
Est. Value
About This Home
This home is located at 1502 N 1750 W, Clearfield, UT 84015 and is currently estimated at $597,982, approximately $163 per square foot. 1502 N 1750 W is a home located in Davis County with nearby schools including Parkside Elementary School, West Point Junior High School, and Clearfield High School.
Ownership History
Date
Name
Owned For
Owner Type
Purchase Details
Closed on
Dec 2, 2024
Sold by
James D Sorensen Revocable Living Trust and Sorensen James D
Bought by
Sorensen Matthew A
Current Estimated Value
Home Financials for this Owner
Home Financials are based on the most recent Mortgage that was taken out on this home.
Original Mortgage
$260,600
Outstanding Balance
$258,904
Interest Rate
6.44%
Mortgage Type
New Conventional
Estimated Equity
$339,078
Purchase Details
Closed on
Dec 27, 2019
Sold by
Sorensen James D
Bought by
Sorensen James D and Sorensen Revocable Liv James D
Purchase Details
Closed on
Sep 27, 2007
Sold by
Sorensen James D and Sorensen Barbara G
Bought by
Sorensen James D
Home Financials for this Owner
Home Financials are based on the most recent Mortgage that was taken out on this home.
Original Mortgage
$220,000
Interest Rate
6.61%
Mortgage Type
New Conventional
Create a Home Valuation Report for This Property
The Home Valuation Report is an in-depth analysis detailing your home's value as well as a comparison with similar homes in the area
Home Values in the Area
Average Home Value in this Area
Purchase History
| Date | Buyer | Sale Price | Title Company |
|---|---|---|---|
| Sorensen Matthew A | -- | Inwest Title | |
| Sorensen James D | -- | None Available | |
| Sorensen James D | -- | Security Title |
Source: Public Records
Mortgage History
| Date | Status | Borrower | Loan Amount |
|---|---|---|---|
| Open | Sorensen Matthew A | $260,600 | |
| Previous Owner | Sorensen James D | $215,513 | |
| Previous Owner | Sorensen James D | $220,000 |
Source: Public Records
Tax History
| Year | Tax Paid | Tax Assessment Tax Assessment Total Assessment is a certain percentage of the fair market value that is determined by local assessors to be the total taxable value of land and additions on the property. | Land | Improvement |
|---|---|---|---|---|
| 2025 | $3,197 | $307,451 | $98,984 | $208,467 |
| 2024 | $3,078 | $297,550 | $107,361 | $190,189 |
| 2023 | $2,919 | $522,000 | $124,687 | $397,313 |
| 2022 | $3,269 | $323,400 | $73,201 | $250,199 |
| 2021 | $2,937 | $431,000 | $96,869 | $334,131 |
| 2020 | $2,575 | $374,000 | $85,208 | $288,792 |
| 2019 | $2,396 | $340,000 | $94,255 | $245,745 |
| 2018 | $2,252 | $314,000 | $78,940 | $235,060 |
| 2016 | $2,173 | $156,420 | $31,325 | $125,095 |
| 2015 | $2,133 | $145,970 | $31,325 | $114,645 |
| 2014 | $2,153 | $149,702 | $31,325 | $118,377 |
| 2013 | -- | $143,705 | $31,349 | $112,356 |
Source: Public Records
Map
Nearby Homes
Your Personal Tour Guide
Ask me questions while you tour the home.