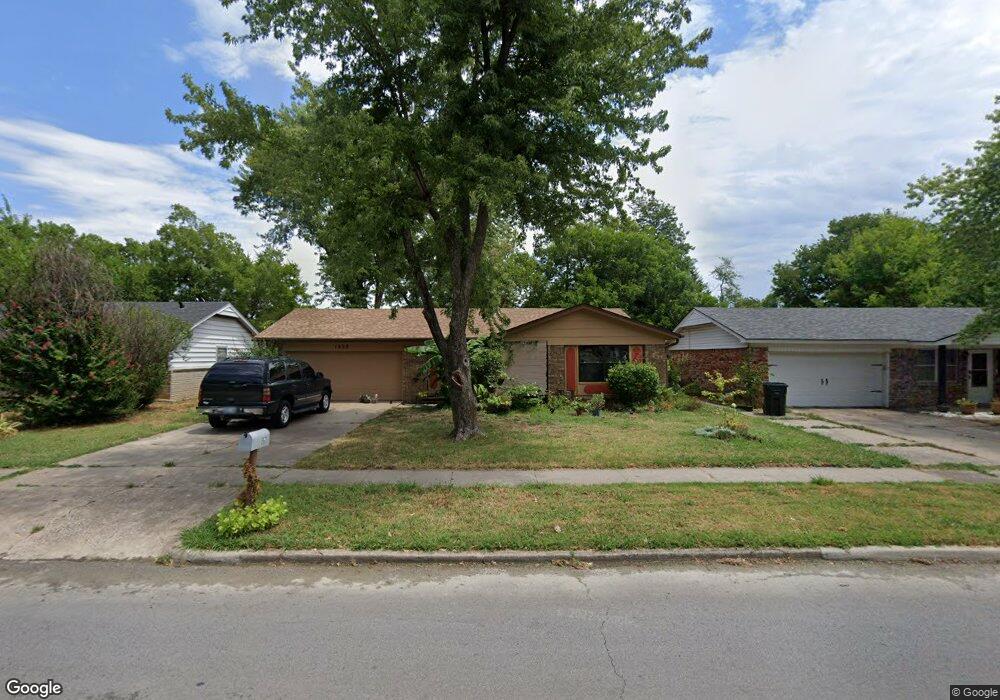
1502 N Chambers Terrace Claremore, OK 74017
Estimated Value: $134,730 - $159,000
3
Beds
1
Bath
900
Sq Ft
$164/Sq Ft
Est. Value
About This Home
This home is located at 1502 N Chambers Terrace, Claremore, OK 74017 and is currently estimated at $147,433, approximately $163 per square foot. 1502 N Chambers Terrace is a home located in Rogers County with nearby schools including Westside Elementary School, Will Rogers Junior High School, and Claremore High School.
Ownership History
Date
Name
Owned For
Owner Type
Purchase Details
Closed on
Jul 6, 2022
Sold by
Sue Sartin Jenny
Bought by
Jenny S Sartin Revocable Living Trust
Current Estimated Value
Purchase Details
Closed on
Dec 30, 2015
Sold by
Lowe Mark Nelson and Lowe Donna Marie
Bought by
Sartin Jenny Sue
Purchase Details
Closed on
Apr 14, 2015
Sold by
Lowe Patricia R
Bought by
Lowe Patricia R and The Lowe Family Revocable Trus
Purchase Details
Closed on
Jun 4, 2013
Sold by
Wentworth Myrtle Isabel and Wentworth Myrtle I
Bought by
Wentworth Arthur Roy and Wentworth Arthur Roy
Purchase Details
Closed on
Apr 28, 2010
Sold by
Wentworth Myrtle Isabel and Wentoworth Myrtle I
Bought by
Wentworh Arthur Roy and Wentworth Arthur Roy
Create a Home Valuation Report for This Property
The Home Valuation Report is an in-depth analysis detailing your home's value as well as a comparison with similar homes in the area
Home Values in the Area
Average Home Value in this Area
Purchase History
| Date | Buyer | Sale Price | Title Company |
|---|---|---|---|
| Jenny S Sartin Revocable Living Trust | -- | None Listed On Document | |
| Sartin Jenny Sue | -- | None Available | |
| Lowe Patricia R | -- | None Available | |
| Wentworth Arthur Roy | -- | None Available | |
| Wentworh Arthur Roy | -- | None Available |
Source: Public Records
Tax History Compared to Growth
Tax History
| Year | Tax Paid | Tax Assessment Tax Assessment Total Assessment is a certain percentage of the fair market value that is determined by local assessors to be the total taxable value of land and additions on the property. | Land | Improvement |
|---|---|---|---|---|
| 2025 | $749 | $8,103 | $2,227 | $5,876 |
| 2024 | $713 | $7,716 | $2,120 | $5,596 |
| 2023 | $713 | $7,349 | $1,972 | $5,377 |
| 2022 | $648 | $6,999 | $1,725 | $5,274 |
| 2021 | $589 | $6,999 | $1,714 | $5,285 |
| 2020 | $581 | $6,665 | $1,636 | $5,029 |
| 2019 | $560 | $6,348 | $1,579 | $4,769 |
| 2018 | $532 | $6,047 | $1,490 | $4,557 |
| 2017 | $504 | $5,484 | $1,369 | $4,115 |
| 2016 | $490 | $5,223 | $1,311 | $3,912 |
| 2015 | $276 | $4,974 | $1,253 | $3,721 |
| 2014 | $276 | $4,974 | $1,231 | $3,743 |
Source: Public Records
Map
Nearby Homes
- 1606 N Chambers Terrace
- 1103 W 20th St
- 1908 N Chambers Terrace
- 208 N Chambers Trail
- 1112 W 20th St
- 902 W 8th St
- 1907 N Chambers Ave
- 1012 W 22nd St
- 205 N Kates Ave
- 1520 Greenleaf St
- 1005 W 23rd St
- 1906 Memorial Dr
- 0 N J M Davis Blvd
- 825 W 23rd St N
- 1110 W 24th St N
- 817 W 24th St N
- 809 W 24th St N
- 119 N Missouri Ave
- 1206 W Haskell St
- 1503 Cedarwood Dr
- 1426 N Chambers Terrace
- 1422 N Chambers Terrace
- 1102 W 15th St
- 1418 N Chambers Terrace
- 1506 N Chambers Terrace
- 1101 W 15th St
- 1106 W 15th St
- 1414 N Chambers Terrace
- 1510 N Chambers Terrace
- 1105 W 15th St
- 1110 W 15th St
- 1102 W 14th Place
- 1410 N Chambers Terrace
- 1101 W 16th St
- 1514 N Chambers Terrace
- 1109 W 15th St
- 1106 W 14th Place
- 1114 W 15th St
- 1105 W 16th Place
- 1105 W 16th Place