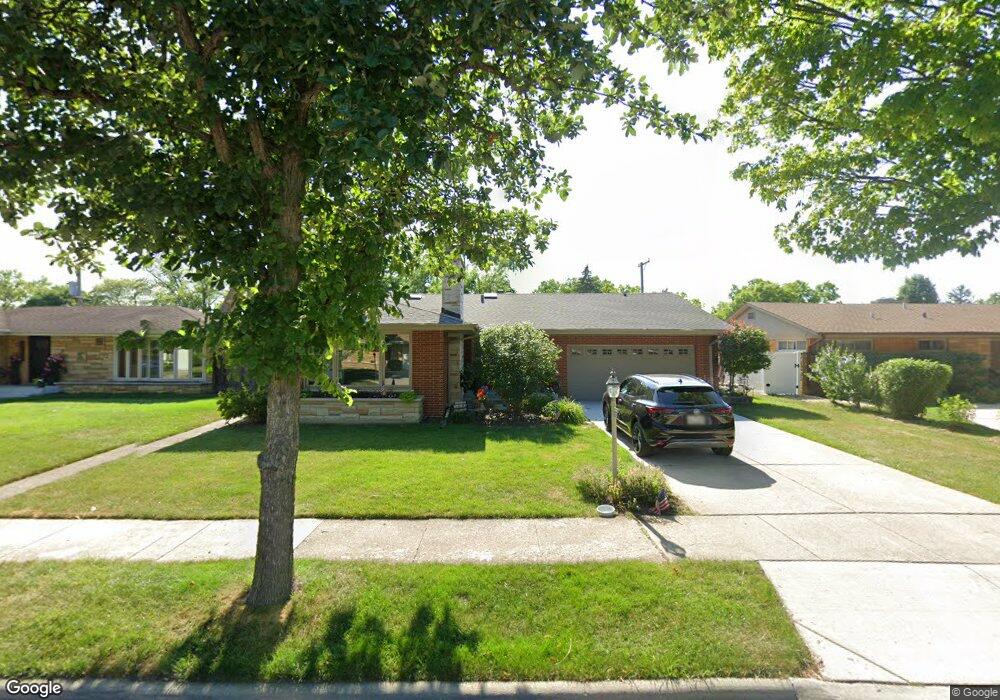
1502 Stonegate Rd La Grange Park, IL 60526
Estimated Value: $493,801 - $592,000
4
Beds
3
Baths
1,608
Sq Ft
$330/Sq Ft
Est. Value
About This Home
This home is located at 1502 Stonegate Rd, La Grange Park, IL 60526 and is currently estimated at $531,200, approximately $330 per square foot. 1502 Stonegate Rd is a home located in Cook County with nearby schools including Forest Road Elementary School, Park Junior High School, and Lyons Township High School.
Ownership History
Date
Name
Owned For
Owner Type
Purchase Details
Closed on
Jan 15, 2018
Sold by
Housner Kathleen Abdul and Housner Alan S
Bought by
Housner Kathleen Abdul and The Kathleen Abdul Housner Living Trust
Current Estimated Value
Purchase Details
Closed on
Aug 30, 2001
Sold by
Abdul M G and Abdul Joan
Bought by
Abdul Neal Kathleen
Home Financials for this Owner
Home Financials are based on the most recent Mortgage that was taken out on this home.
Original Mortgage
$100,000
Outstanding Balance
$39,108
Interest Rate
7.03%
Estimated Equity
$492,092
Purchase Details
Closed on
May 27, 1999
Sold by
Connerth Martha F
Bought by
Abdul M C and Abdul Joan
Purchase Details
Closed on
Apr 3, 1999
Sold by
Connerth Robert W
Bought by
Connerth Martha F
Purchase Details
Closed on
Apr 4, 1994
Sold by
Connerth Martha F
Bought by
Connerth Martha F and Connerth Robert W
Create a Home Valuation Report for This Property
The Home Valuation Report is an in-depth analysis detailing your home's value as well as a comparison with similar homes in the area
Home Values in the Area
Average Home Value in this Area
Purchase History
| Date | Buyer | Sale Price | Title Company |
|---|---|---|---|
| Housner Kathleen Abdul | -- | Attorney | |
| Abdul Neal Kathleen | $170,000 | Chicago Title Insurance Co | |
| Abdul M C | $170,000 | -- | |
| Connerth Martha F | -- | -- | |
| Connerth Martha F | -- | -- |
Source: Public Records
Mortgage History
| Date | Status | Borrower | Loan Amount |
|---|---|---|---|
| Open | Abdul Neal Kathleen | $100,000 | |
| Closed | Abdul Neal Kathleen | $10,000 |
Source: Public Records
Tax History Compared to Growth
Tax History
| Year | Tax Paid | Tax Assessment Tax Assessment Total Assessment is a certain percentage of the fair market value that is determined by local assessors to be the total taxable value of land and additions on the property. | Land | Improvement |
|---|---|---|---|---|
| 2024 | $9,581 | $36,697 | $5,775 | $30,922 |
| 2023 | $8,107 | $40,829 | $5,775 | $35,054 |
| 2022 | $8,107 | $30,063 | $5,075 | $24,988 |
| 2021 | $7,818 | $30,063 | $5,075 | $24,988 |
| 2020 | $7,700 | $30,063 | $5,075 | $24,988 |
| 2019 | $7,806 | $30,841 | $4,550 | $26,291 |
| 2018 | $8,399 | $33,436 | $4,550 | $28,886 |
| 2017 | $8,195 | $33,436 | $4,550 | $28,886 |
| 2016 | $8,156 | $29,493 | $4,200 | $25,293 |
| 2015 | $7,299 | $29,493 | $4,200 | $25,293 |
| 2014 | $7,201 | $29,493 | $4,200 | $25,293 |
| 2013 | $7,686 | $31,998 | $4,200 | $27,798 |
Source: Public Records
Map
Nearby Homes
- 205 Huntington Ct
- 213 Pine Tree Ln
- 4 Garden Dr Unit 4
- 1427 Homestead Rd Unit H
- 1427 Homestead Rd Unit F
- 1132 Community Dr
- 314 E 31st St
- 1436 Kemman Ave
- 10511 Preston St
- 929 Sherwood Rd
- 1518 Cleveland Ave
- 1427 Cleveland Ave
- 2623 Sunnyside Ave
- 1919 Suffolk Ave
- 1245 Morgan Ave
- 818 N La Grange Rd
- 1907 Suffolk Ave
- 10610 Essex St
- 836 N Waiola Ave
- 1900 Manchester Ave
- 1438 Stonegate Rd
- 1506 Stonegate Rd
- 1501 Deerpath Ln
- 1505 Deerpath Ln
- 1437 Deerpath Ln
- 1434 Stonegate Rd
- 1510 Stonegate Rd
- 1505 Stonegate Rd
- 1501 Stonegate Rd
- 1509 Deerpath Ln
- 1433 Deerpath Ln
- 1437 Stonegate Rd
- 1509 Stonegate Rd
- 1430 Stonegate Rd
- 1514 Stonegate Rd
- 1429 Deerpath Ln
- 1513 Deerpath Ln
- 1513 Stonegate Rd
- 1502 Deerpath Ln
- 1506 Deerpath Ln