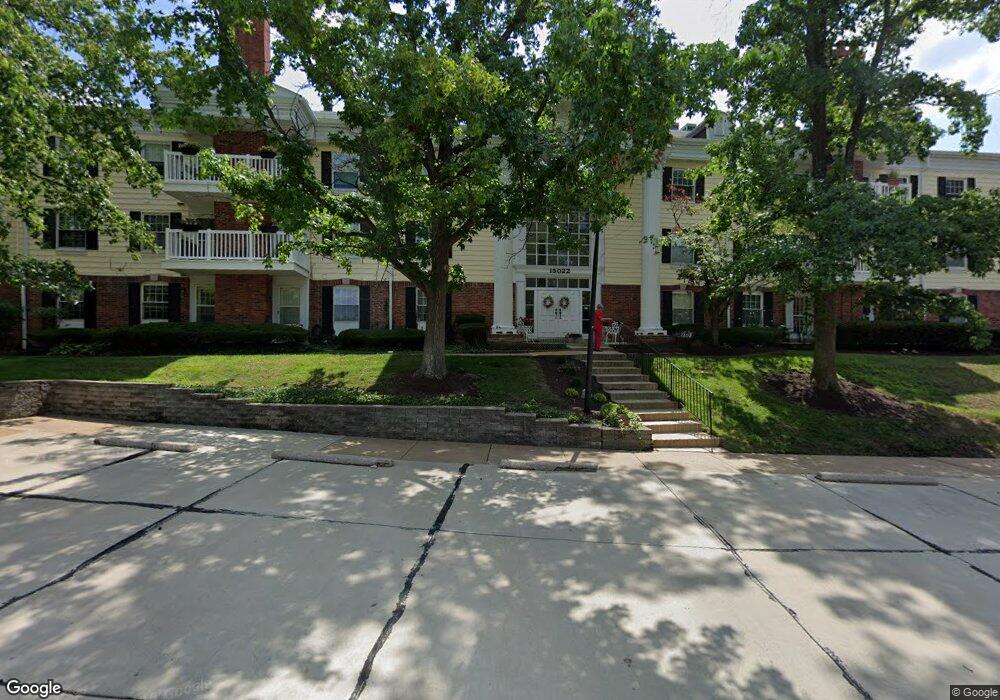
15022 Claymoor Ct Unit 9 Chesterfield, MO 63017
Estimated Value: $220,000 - $271,000
2
Beds
2
Baths
1,294
Sq Ft
$185/Sq Ft
Est. Value
About This Home
This home is located at 15022 Claymoor Ct Unit 9, Chesterfield, MO 63017 and is currently estimated at $239,402, approximately $185 per square foot. 15022 Claymoor Ct Unit 9 is a home located in St. Louis County with nearby schools including Claymont Elementary School, Parkway West Middle School, and Parkway West High School.
Ownership History
Date
Name
Owned For
Owner Type
Purchase Details
Closed on
Nov 28, 2000
Sold by
Hugh Voss F and Hugh Betty R
Bought by
Walters Michael L and Walters Alonda J
Current Estimated Value
Home Financials for this Owner
Home Financials are based on the most recent Mortgage that was taken out on this home.
Original Mortgage
$107,200
Outstanding Balance
$39,388
Interest Rate
7.84%
Estimated Equity
$200,014
Purchase Details
Closed on
Dec 1, 1998
Sold by
Kinen Carol Jane and Kinen Philip Stridfeldt
Bought by
Voss F Hugh and Voss Betty R
Home Financials for this Owner
Home Financials are based on the most recent Mortgage that was taken out on this home.
Original Mortgage
$70,000
Interest Rate
6.81%
Purchase Details
Closed on
Apr 30, 1997
Sold by
Lake Eleanor G
Bought by
Kinen Carol Jane and Kinen Philip Stridfeldt
Home Financials for this Owner
Home Financials are based on the most recent Mortgage that was taken out on this home.
Original Mortgage
$92,250
Interest Rate
7.97%
Create a Home Valuation Report for This Property
The Home Valuation Report is an in-depth analysis detailing your home's value as well as a comparison with similar homes in the area
Home Values in the Area
Average Home Value in this Area
Purchase History
| Date | Buyer | Sale Price | Title Company |
|---|---|---|---|
| Walters Michael L | $134,000 | -- | |
| Walters Michael L | $134,000 | -- | |
| Voss F Hugh | $123,000 | -- | |
| Kinen Carol Jane | -- | -- |
Source: Public Records
Mortgage History
| Date | Status | Borrower | Loan Amount |
|---|---|---|---|
| Open | Walters Michael L | $107,200 | |
| Closed | Walters Michael L | $107,200 | |
| Previous Owner | Voss F Hugh | $70,000 | |
| Previous Owner | Kinen Carol Jane | $92,250 |
Source: Public Records
Tax History Compared to Growth
Tax History
| Year | Tax Paid | Tax Assessment Tax Assessment Total Assessment is a certain percentage of the fair market value that is determined by local assessors to be the total taxable value of land and additions on the property. | Land | Improvement |
|---|---|---|---|---|
| 2025 | $2,326 | $40,730 | $13,030 | $27,700 |
| 2024 | $2,326 | $36,140 | $7,370 | $28,770 |
| 2023 | $2,293 | $36,140 | $7,370 | $28,770 |
| 2022 | $1,987 | $28,460 | $9,840 | $18,620 |
| 2021 | $1,975 | $28,460 | $9,840 | $18,620 |
| 2020 | $1,881 | $25,690 | $8,110 | $17,580 |
| 2019 | $1,860 | $25,690 | $8,110 | $17,580 |
| 2018 | $1,766 | $22,630 | $4,920 | $17,710 |
| 2017 | $1,715 | $22,630 | $4,920 | $17,710 |
| 2016 | $1,728 | $21,700 | $2,830 | $18,870 |
| 2015 | $1,810 | $21,700 | $2,830 | $18,870 |
| 2014 | $1,619 | $20,670 | $2,280 | $18,390 |
Source: Public Records
Map
Nearby Homes
- 15009 Claymoor Ct Unit 15
- 15009 Claymoor Ct Unit 11
- 2452 Claymoor Dr
- 15038 Claymoor Ct Unit 10
- 15038 Claymoor Ct Unit 3
- 15047 Green Circle Dr
- 2335 Manor Grove Dr Unit 9
- 2323 Manor Grove Dr Unit 4
- 449 Wildwood Pkwy
- 103 Calico Ln
- 106 Five Meadows Ln
- 108 Old Oaks Dr
- 770 Straub Rd
- 2021 Brook Hill Ct
- 496 Brightspur Ln
- 406 Monticello Dr
- 612 Corley Ct
- 713 Clayton Corners Dr
- 14681 Amberleigh Hill Ct
- 520 Kingridge Dr
- 15022 Claymoor Ct Unit 3
- 15022 Claymoor Ct Unit 18
- 15022 Claymoor Ct Unit 14
- 15022 Claymoor Ct Unit 12
- 15022 Claymoor Ct Unit 7
- 15022 Claymoor Ct Unit 15
- 15022 Claymoor Ct Unit 6
- 15022 Claymoor Ct Unit 5
- 15022 Claymoor Ct Unit 4
- 15022 Claymoor Ct Unit 11
- 15022 Claymoor Ct Unit 16
- 15022 Claymoor Ct Unit 2
- 15022 Claymoor Ct Unit 10
- 15022 Claymoor Ct Unit 8
- 15022 Claymoor Ct Unit 17
- 15022 Claymoor Ct Unit 13
- 2401 Clayton Pointe Ct
- 2405 Clayton Pointe Ct
- 2409 Clayton Pointe Ct
- 2413 Clayton Pointe Ct