1503 Cambridge Ave SW Unit 1503 North Canton, OH 44709
Mount Vernon NeighborhoodEstimated Value: $198,000 - $218,000
2
Beds
2
Baths
1,254
Sq Ft
$167/Sq Ft
Est. Value
About This Home
This home is located at 1503 Cambridge Ave SW Unit 1503, North Canton, OH 44709 and is currently estimated at $209,821, approximately $167 per square foot. 1503 Cambridge Ave SW Unit 1503 is a home located in Stark County with nearby schools including Orchard Hill Intermediate School, North Canton Middle School, and Hoover High School.
Ownership History
Date
Name
Owned For
Owner Type
Purchase Details
Closed on
May 4, 2015
Sold by
Kenny Margaret A
Bought by
Swan Mary L
Current Estimated Value
Purchase Details
Closed on
Aug 7, 2003
Sold by
Anderson James H
Bought by
Kenny Harold M and Kenny Margaret A
Home Financials for this Owner
Home Financials are based on the most recent Mortgage that was taken out on this home.
Original Mortgage
$60,000
Interest Rate
5.31%
Mortgage Type
Purchase Money Mortgage
Purchase Details
Closed on
Jul 7, 1999
Sold by
R R Stark Co
Bought by
Anderson James H
Home Financials for this Owner
Home Financials are based on the most recent Mortgage that was taken out on this home.
Original Mortgage
$88,700
Interest Rate
7.28%
Create a Home Valuation Report for This Property
The Home Valuation Report is an in-depth analysis detailing your home's value as well as a comparison with similar homes in the area
Home Values in the Area
Average Home Value in this Area
Purchase History
| Date | Buyer | Sale Price | Title Company |
|---|---|---|---|
| Swan Mary L | $80,100 | None Available | |
| Kenny Harold M | $127,900 | Quest Title Agency Inc | |
| Anderson James H | $110,900 | -- |
Source: Public Records
Mortgage History
| Date | Status | Borrower | Loan Amount |
|---|---|---|---|
| Previous Owner | Kenny Harold M | $60,000 | |
| Previous Owner | Anderson James H | $88,700 | |
| Closed | Kenny Harold M | $61,500 |
Source: Public Records
Tax History Compared to Growth
Tax History
| Year | Tax Paid | Tax Assessment Tax Assessment Total Assessment is a certain percentage of the fair market value that is determined by local assessors to be the total taxable value of land and additions on the property. | Land | Improvement |
|---|---|---|---|---|
| 2025 | -- | $60,520 | $16,490 | $44,030 |
| 2024 | -- | $60,520 | $16,490 | $44,030 |
| 2023 | $1,922 | $45,090 | $11,940 | $33,150 |
| 2022 | $1,870 | $45,090 | $11,940 | $33,150 |
| 2021 | $1,804 | $45,090 | $11,940 | $33,150 |
| 2020 | $1,817 | $41,730 | $10,890 | $30,840 |
| 2019 | $1,702 | $41,730 | $10,890 | $30,840 |
| 2018 | $1,764 | $41,730 | $10,890 | $30,840 |
| 2017 | $1,546 | $39,100 | $10,640 | $28,460 |
| 2016 | $1,552 | $39,100 | $10,640 | $28,460 |
| 2015 | $1,482 | $39,100 | $10,640 | $28,460 |
| 2014 | $87 | $36,930 | $11,450 | $25,480 |
| 2013 | $1,047 | $36,930 | $11,450 | $25,480 |
Source: Public Records
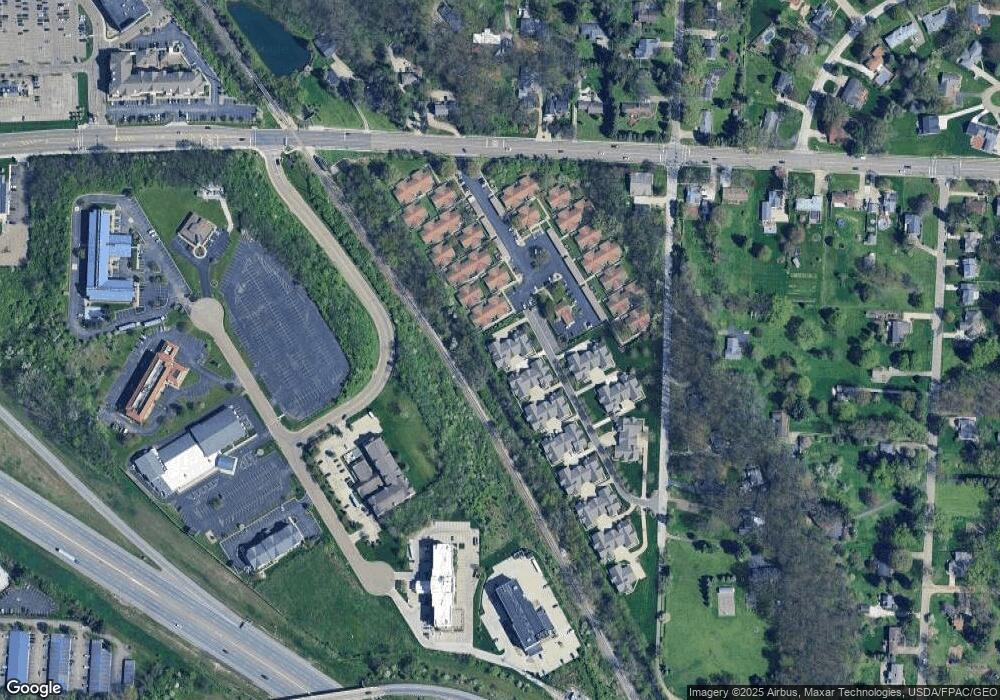
Map
Nearby Homes
- 0 Elberta Ave SW
- 1443 Wilkshire Cir SW
- VL Edgemont St NW
- 1276 Linwood Ave SW
- 1138 Lindy Lane Ave SW
- 256 Everhard Rd SW
- 4628 Westwood Ave NW
- 4646 Woodside Ave NW
- 4220 Tannybrooke Ln NW Unit B
- 218 Bonnett St SW
- 139 Maplecrest St SW
- 236 Rose Lane St SW
- 1603 S Main St Unit B
- 727 Lorena St SW
- 2525 44th St NW
- 2521 44th St NW
- 326 Bachtel St SW
- 1653 Greenway Rd SE Unit 202
- 4740 Echoglenn St NW
- 1381 Circle Hill Rd SE
- 1505 Cambridge Ave SW Unit 1505
- 1501 Cambridge Ave SW Unit 1501
- 1507 Cambridge Ave SW Unit 1507
- 1513 Cambridge Ave SW Unit 1513
- 1511 Cambridge Ave SW Unit 1511
- 1515 Cambridge Ave SW Unit 1515
- 1517 Cambridge Ave SW Unit 7A1517
- 1523 Cambridge Ave SW Unit 1523
- 1521 Cambridge Ave SW Unit 1521
- 1514 Cambridge Ave SW Unit 1514
- 1525 Cambridge Ave SW Unit 1525
- 800 Everhard Rd NW
- 1516 Cambridge Ave SW Unit 1516
- 1512 Cambridge Ave SW Unit 1512
- 1531 Cambridge Ave SW Unit 5A1531
- 800 Everhard Rd SW
- 1524 Cambridge Ave SW
- 1522 Cambridge Ave SW Unit 1522
- 1535 Cambridge Ave SW Unit 5A1535
- 1526 Cambridge Ave SW Unit 1526