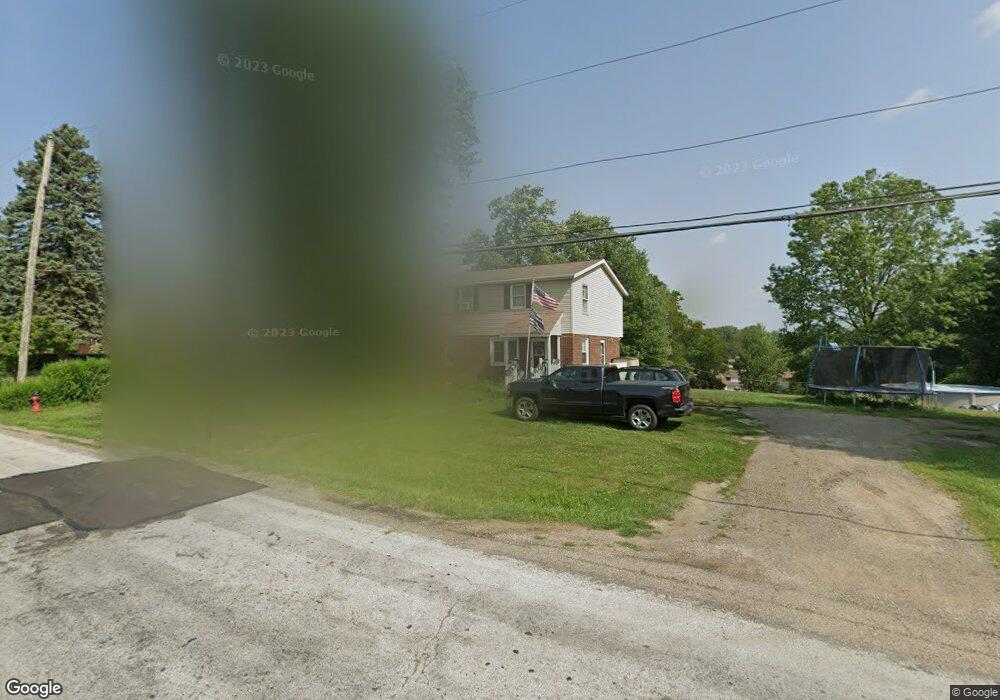
1503 Carnwise St SW Canton, OH 44706
Estimated Value: $168,820 - $216,000
3
Beds
1
Bath
1,440
Sq Ft
$129/Sq Ft
Est. Value
About This Home
This home is located at 1503 Carnwise St SW, Canton, OH 44706 and is currently estimated at $186,205, approximately $129 per square foot. 1503 Carnwise St SW is a home located in Stark County with nearby schools including Faircrest Memorial Elementary School, Canton South High School, and Beacon Academy.
Ownership History
Date
Name
Owned For
Owner Type
Purchase Details
Closed on
Nov 28, 2023
Sold by
Minor Daniel R and Miner Robin A
Bought by
Minor Eric D and Minor Lake C
Current Estimated Value
Purchase Details
Closed on
Oct 14, 2021
Sold by
Minor Daniel R and Minor Robin A
Bought by
Minor Lake C and Minor Eric D
Home Financials for this Owner
Home Financials are based on the most recent Mortgage that was taken out on this home.
Original Mortgage
$131,461
Interest Rate
2.8%
Mortgage Type
FHA
Purchase Details
Closed on
Dec 30, 2005
Sold by
Popa George Paul and Popa Rachel L
Bought by
Jx4 Inc
Purchase Details
Closed on
Jan 12, 1990
Create a Home Valuation Report for This Property
The Home Valuation Report is an in-depth analysis detailing your home's value as well as a comparison with similar homes in the area
Home Values in the Area
Average Home Value in this Area
Purchase History
| Date | Buyer | Sale Price | Title Company |
|---|---|---|---|
| Minor Eric D | -- | None Listed On Document | |
| Minor Lake C | $136,000 | Patriot Title Agency Inc | |
| Jx4 Inc | -- | None Available | |
| Minor Daniel R | $64,500 | None Available | |
| -- | $49,900 | -- |
Source: Public Records
Mortgage History
| Date | Status | Borrower | Loan Amount |
|---|---|---|---|
| Previous Owner | Minor Lake C | $131,461 |
Source: Public Records
Tax History Compared to Growth
Tax History
| Year | Tax Paid | Tax Assessment Tax Assessment Total Assessment is a certain percentage of the fair market value that is determined by local assessors to be the total taxable value of land and additions on the property. | Land | Improvement |
|---|---|---|---|---|
| 2025 | -- | $47,600 | $13,580 | $34,020 |
| 2024 | -- | $47,600 | $13,580 | $34,020 |
| 2023 | $1,494 | $33,120 | $9,140 | $23,980 |
| 2022 | $1,386 | $33,120 | $9,140 | $23,980 |
| 2021 | $1,423 | $33,120 | $9,140 | $23,980 |
| 2020 | $773 | $15,720 | $7,740 | $7,980 |
| 2019 | $784 | $15,720 | $7,740 | $7,980 |
| 2018 | $779 | $15,720 | $7,740 | $7,980 |
| 2017 | $752 | $14,320 | $7,180 | $7,140 |
| 2016 | $753 | $14,320 | $7,180 | $7,140 |
| 2015 | $778 | $14,780 | $7,180 | $7,600 |
| 2014 | $699 | $12,470 | $6,270 | $6,200 |
| 2013 | $354 | $12,470 | $6,270 | $6,200 |
Source: Public Records
Map
Nearby Homes
- 3673 Highview Ave SW
- 327 39th St SW
- 4434 Millport Ave SW
- 331 Millview Place SW
- 114 29th St SW
- 223 Faircrest St SW
- 2000 Prairie College St SW
- 0 20th St SW
- 2001 Bryan Ave SW
- 1700 Clark Ave SW
- 1015 53rd St SW
- 1622 Clarendon Ave SW
- 1547 Alden Ave SW
- 502 Fohl St SW
- 0 Rexdale St SW
- 1356 Margaret Ave SW
- 1729 Gambrinus Ave SW
- 3810 Rexdale St SW
- 1334 Margaret Ave SW
- 5434 Briggle Ave SW
- 1511 Carnwise St SW
- 1425 Carnwise St SW
- 1425 Carnwise St SW
- 1517 Carnwise St SW
- 1419 Carnwise St SW
- 1525 Carnwise St SW
- 1426 Carnwise St SW
- 1510 Carnwise St SW
- 1407 Carnwise St SW
- 1531 Carnwise St SW
- 1412 Coty Dr SW
- 1601 Carnwise St SW
- 1404 Coty Dr SW
- 1510 Bravado Rd SW
- 1420 Coty Dr SW
- 1331 Carnwise St SW
- 1511 George St SW
- 1427 George St SW
- 1609 Carnwise St SW
- 1330 Carnwise St SW