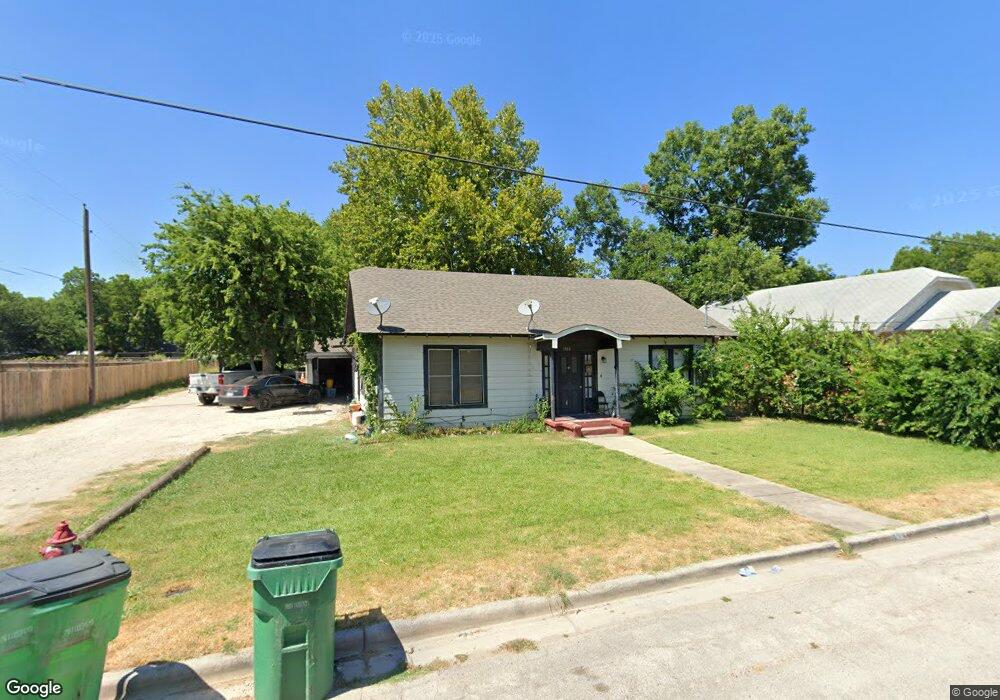
1503 E Garnett St Gainesville, TX 76240
Estimated Value: $159,000 - $236,000
3
Beds
2
Baths
1,252
Sq Ft
$151/Sq Ft
Est. Value
About This Home
This home is located at 1503 E Garnett St, Gainesville, TX 76240 and is currently estimated at $189,375, approximately $151 per square foot. 1503 E Garnett St is a home located in Cooke County with nearby schools including Edison Elementary School, W.E. Chalmers Elementary School, and Gainesville Jr. High School.
Ownership History
Date
Name
Owned For
Owner Type
Purchase Details
Closed on
Sep 21, 2012
Sold by
Citimortgage Inc
Bought by
Castro Arcelia and Rivera Pedro
Current Estimated Value
Purchase Details
Closed on
Nov 3, 2006
Sold by
Hunter Johnny and Hunter Jennifer
Bought by
Hernandez - Barrientos Maura
Home Financials for this Owner
Home Financials are based on the most recent Mortgage that was taken out on this home.
Original Mortgage
$68,979
Interest Rate
9.4%
Mortgage Type
Adjustable Rate Mortgage/ARM
Purchase Details
Closed on
Sep 22, 2005
Sold by
Faubion Monte Gayle
Bought by
Hunter Johnny
Home Financials for this Owner
Home Financials are based on the most recent Mortgage that was taken out on this home.
Original Mortgage
$23,500
Interest Rate
5.88%
Mortgage Type
Purchase Money Mortgage
Create a Home Valuation Report for This Property
The Home Valuation Report is an in-depth analysis detailing your home's value as well as a comparison with similar homes in the area
Purchase History
| Date | Buyer | Sale Price | Title Company |
|---|---|---|---|
| Castro Arcelia | -- | None Available | |
| Hernandez - Barrientos Maura | -- | -- | |
| Hunter Johnny | -- | -- |
Source: Public Records
Mortgage History
| Date | Status | Borrower | Loan Amount |
|---|---|---|---|
| Previous Owner | Hernandez - Barrientos Maura | $68,979 | |
| Previous Owner | Hunter Johnny | $23,500 |
Source: Public Records
Tax History
| Year | Tax Paid | Tax Assessment Tax Assessment Total Assessment is a certain percentage of the fair market value that is determined by local assessors to be the total taxable value of land and additions on the property. | Land | Improvement |
|---|---|---|---|---|
| 2025 | $2,802 | $147,866 | $36,935 | $110,931 |
| 2024 | $2,802 | $147,866 | $36,935 | $110,931 |
| 2023 | $2,687 | $136,976 | $33,578 | $103,398 |
| 2022 | $2,796 | $128,442 | $29,947 | $98,495 |
| 2021 | $2,352 | $91,338 | $19,965 | $71,373 |
| 2020 | $2,120 | $79,842 | $19,058 | $60,784 |
| 2019 | $1,965 | $71,917 | $19,058 | $52,859 |
| 2018 | $1,571 | $57,583 | $9,528 | $48,055 |
| 2017 | $1,504 | $55,337 | $9,528 | $45,809 |
| 2015 | $1,449 | $54,442 | $9,528 | $44,914 |
| 2014 | $1,449 | $54,442 | $9,528 | $44,914 |
Source: Public Records
Map
Nearby Homes
- 405 Meadow Dr
- 506 Meadow Dr
- 1601 Cherry St
- 1520 Harris St
- 1522 Harris St
- 701 S Clements St
- 410 S Grand Ave
- 1704 Harris St
- 213 S Clements St
- 1722 Morningside Dr
- 1734 E California St
- 1905 Bridle Ln
- 1108 Locust St
- 1907 Bridle Ln
- 313 Fair Ave
- 316 Ritchey St
- 1201 Fm
- 1118 S Grand Ave
- 1800 Silver Oaks Dr
- 1103 Vintage Ave
- 1507 E Garnett St
- 1417 E Garnett St
- 1413 E Garnett St
- 1504 Truelove St
- 1424 Truelove St
- 1510 Truelove St
- 1502 E Garnett St
- 1508 E Garnett St
- 1516 E Garnett St
- 1428 E Garnett St
- 1411 E Garnett St
- 1515 E Garnett St
- 1510 E Garnett St
- 1418 Truelove St
- 1514 Truelove St
- 1406 E Garnett St
- 1512 E Garnett St
- 1520 Truelove St
- 1414 Truelove St
- 1514 E Garnett St
Your Personal Tour Guide
Ask me questions while you tour the home.